// Building Observability for Test Automation with Metrics, Logs, and Alerts
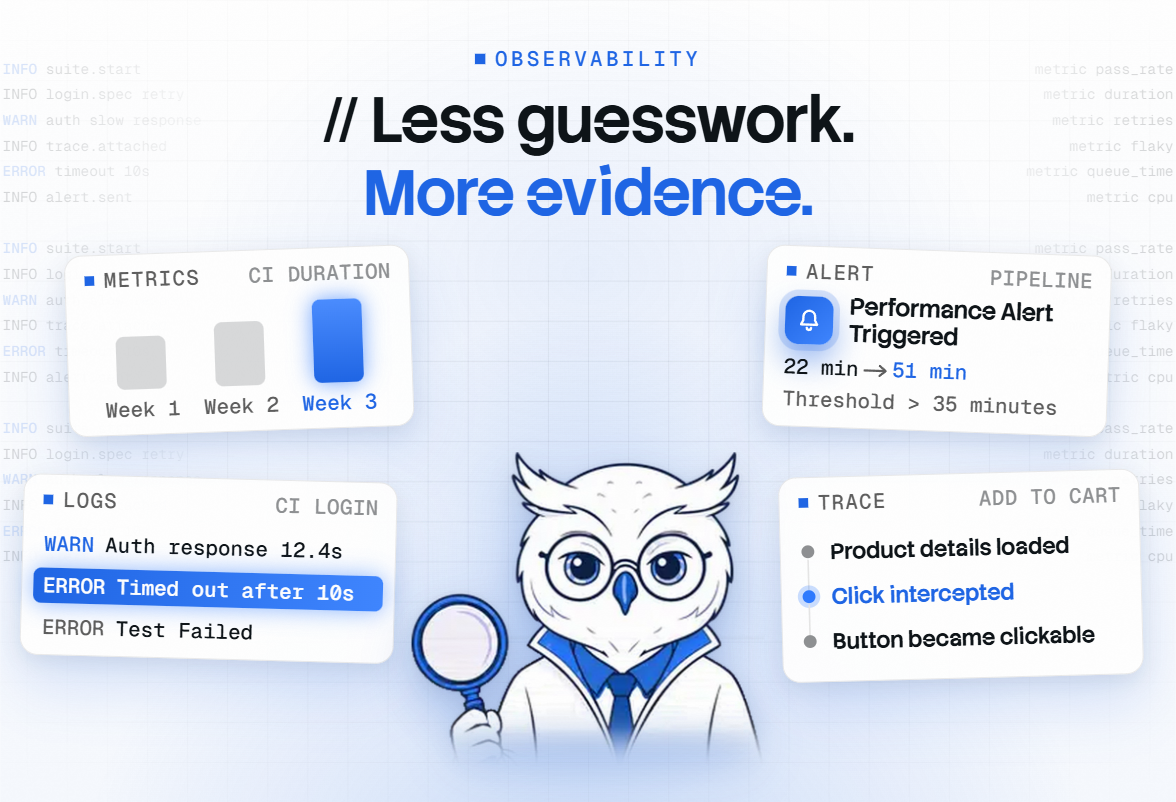
Observability transforms test automation from a black box into a system you can truly rely on. When your tests fail, become sluggish, or start acting erratically, metrics, logs, and alerts provide the insights needed to pinpoint what changed and where to begin your investigation.
This blog post will explore how to implement observability for test automation, highlight its importance for QA and DevOps teams, and demonstrate how to leverage metrics, logs, and alerts to enhance visibility throughout your automation pipeline. We'll also discuss how observability stacks up against traditional test reporting, examine the practical advantages and disadvantages of adopting it, identify the primary types of observability signals, and explain how each contributes to quicker debugging and more robust test suites.
What observability means in test automation
Observability in test automation is all about understanding the state of your test system by examining its outputs. It goes beyond simply knowing if a test passed or failed. With observability, you can analyze metrics to spot trends, dive into logs for detailed execution context, and receive alerts to quickly identify when something is not right.
This is crucial for QA teams because test automation failures often indicate underlying problems. A failed test could be caused by a flaky selector, a sluggish environment, a service outage, or a deployment issue. Observability provides the necessary evidence to distinguish between these possibilities, allowing you to respond more effectively.
This approach also helps teams shift from a reactive debugging style. With observability established, you won't have to wait for a pipeline to fail before realizing there's an issue. Instead, you can spot trends sooner, monitor the overall health of your test suite, and address minor problems before they escalate into release blockers.
Observability can be usefully understood by considering three key questions: What's going on? Why is it happening? And how significant is the problem? This makes it more effective than basic reporting because it links test outcomes to actual behavior, the environment, and timing.
Why observability matters for QA and DevOps
Test automation without observability can feel like you're just guessing in the dark. A report might tell you that ten tests failed, but it won't necessarily reveal if the problem stems from a new application bug, an unstable test environment, or an issue with CI resources.
Observability is crucial because it empowers teams to resolve issues more quickly when they arise. QA engineers can identify trends in failure rates, DevOps teams can detect infrastructure-related problems, and developers can determine if an issue is isolated to a single test or indicative of a larger system-wide problem. This shared understanding minimizes back-and-forth communication and speeds up the process of fixing failures.
Furthermore, observability aids in tracking long-term quality trends. By monitoring key indicators over time, you can detect increasing test flakiness, rising execution times, or recurring deployment-related failures before they jeopardize releases. Consequently, observability is valuable not only for debugging but also for planning, ensuring release confidence, and maintaining operational stability.
In today's delivery pipelines, QA and DevOps frequently share accountability for release health. Observability makes this shared responsibility manageable by allowing both teams to examine the same data and make informed decisions. Whether the test suite is slowing down or a particular browser is experiencing more frequent failures, the issue becomes apparent early on, facilitating discussions based on concrete evidence rather than assumptions.
How metrics, logs, and alerts work together
Metrics, logs, and alerts are most effective when they function as an integrated system, rather than as standalone tools. Metrics indicate changes, logs explain what occurred, and alerts signal when intervention is necessary.
For instance, a metric might reveal an increase in failed test runs following a deployment. Logs can then pinpoint the specific selector or request that failed. An alert can notify the team if the failure rate exceeds a certain threshold, allowing the issue to be addressed before it impacts additional pipelines. When used in conjunction, these signals form a comprehensive debugging loop, enabling teams to respond more rapidly and with greater understanding.
This interconnectedness is crucial because each signal addresses a distinct aspect of a problem. Metrics excel at tracking trends and volumes. Logs are invaluable for detailed examination and diagnosis. Alerts are essential for conveying urgency and facilitating coordination. Relying on only one of these tools often results in an incomplete understanding of the situation.
Consider a practical scenario: a checkout test fails three times within an hour. Metrics would highlight this surge, logs would indicate a slowdown in the payment API, and alerts would inform the team of the recurring problem. With all three components working in harmony, the team can efficiently determine whether the issue lies with the application, the test itself, or the surrounding environment.
Common observability signals in automation
When it comes to test automation, the most helpful observability signals generally fall into a few practical categories. You can monitor trends in pass/fail rates, how long tests take to run, how many times tests are retried, how often flaky tests occur, and failures related to the environment. These signals give you insight into whether your automation is performing well or gradually declining.
Additionally, you can keep an eye on pipeline-level signals, like the number of jobs that fail, the time spent on each stage, and how often timeouts cause failures. If a regression starts showing only after a deployment or exclusively in a particular browser, observability makes spotting that pattern much simpler.
The more consistent your signal collection is, the easier it will be to troubleshoot problems. A test suite that produces clear logs, well-structured metrics, and relevant alerts is significantly easier to maintain than one that simply indicates a pass or fail.
In real teams, a few signals tend to matter most. Test duration helps identify slow builds. Failure rate shows whether stability is improving or getting worse. Retry count reveals flaky behavior that might not be visible in a single run. Alert frequency tells you whether a problem is isolated or recurring. Together, these signals help you move from isolated failures to system-level insight.
How observability compares to traditional test reporting
| Approach | Key Difference | Best Use Case |
| Traditional test reporting | Shows pass/fail results and basic execution details | Small suites or simple QA reporting |
| Observability for test automation | Combines metrics, logs, and alerts for deeper insight | Teams that need debugging, trend tracking, and pipeline visibility |
| Manual debugging | Relies on engineers checking outputs one by one | One-off failures or small ad hoc investigations |
Observability stands out because it gives you more than a snapshot. Traditional reporting is useful, but it often stops at status and duration. Observability helps you understand patterns over time, which makes it far better for large teams or growing automation suites.
Compared with manual debugging, observability is more scalable. Instead of asking someone to inspect every failure individually, the system itself surfaces the signals that matter. That makes it easier to manage failures in CI, especially when multiple jobs and test stages run in parallel.
Traditional reporting is still helpful for everyday test visibility. A team needs to know whether a build passed, which tests failed, and how long the run took. But once the suite grows, those basic answers are no longer enough. You also need to know whether the failures are concentrated in one area, whether they happen after certain deployments, and whether the issue is tied to infrastructure or application behavior. Observability fills that gap.
Pros and cons of observability for test automation
Pros
- Improves visibility into test health.
- Helps detect flaky tests earlier.
- Makes debugging faster and more structured.
- Supports better collaboration across QA, DevOps, and development teams.
- Helps identify long-term quality trends.
Cons
- Requires setup and maintenance.
- Can generate too much data if not filtered well.
- Needs consistent logging and naming conventions.
- May take time before teams use it effectively.
Observability is a strong choice for teams that want to scale test automation with confidence. It may be less useful for very small suites where the overhead is higher than the value, but for most growing teams the visibility gains are worth it.
The biggest advantage is that observability turns guesswork into evidence. Instead of relying on memory or intuition, teams can point to actual metrics and logs when discussing a failure. That makes root cause analysis easier and release decisions more reliable.
The main trade-off is effort. You need to define what to measure, how to log it, where to alert, and what thresholds matter. If you collect too much noise, observability can become distracting instead of helpful. The goal is not to log everything; the goal is to log the right things in a way that helps the team act quickly.
Types of observabilities in test automation
Metric-based observability
Metric-based observability focuses on numbers. In test automation, these numbers may include the percentage of failed tests, the average test run time, the number of retries, or the frequency of flaky runs. These metrics help teams spot trends instead of reacting only to individual failures.
Use this type when you want to understand the health of the test suite over time. It is especially useful for release reporting, CI health tracking, and identifying whether performance is improving or degrading. For example, if average test duration keeps increasing, metrics can help you catch that regression early.
Metrics are also valuable when leadership or product teams ask about quality trends. A red or green build is not always enough to explain the state of automation. A simple chart showing that failure rate dropped over three weeks, or that retries increased after a specific release, gives more meaningful insight.
Example:
Scenario: A smoke suite typically completes in about 12 minutes. Over two weeks, the engineering dashboard begins reporting longer execution times.

Metrics Dashboard
CI Performance Metrics

Week 1
Average Duration: 12 min
Average CPU Usage: 48%
Queue Time: 30 sec

Week 2
Average Duration: 16 min
Average CPU Usage: 81%
Queue Time: 3 min

Week 3
Average Duration: 23 min
Average CPU Usage: 94%
Queue Time: 8 min

Investigation
The number of automated tests remained unchanged.
Test execution time per test stayed relatively stable.
CI metrics showed build agents were overloaded during peak hours.
Additional CI runners were added, reducing queue time and restoring pipeline duration.

Root Cause
The slowdown was not caused by the tests. It resulted from insufficient CI infrastructure capacity, which increased queue times and delayed pipeline execution.
This example shows how metrics help you move from a single failure to a trend-based diagnosis. That is useful because a test suite often breaks gradually, not all at once.
Log-based observability
Log-based observability focuses on the detailed record of what happened during execution. Logs may include test steps, console errors, request failures, selector issues, environment warnings, or setup messages.
Use this type when you need more context around a failure. Logs are especially helpful when a test fails in CI but seems fine locally, because the log often exposes environment differences, hidden warnings, or timing-related messages. Well-structured logs make it easier to trace a problem back to its source.
Logs are also useful when multiple systems are involved. A single test failure might be caused by a browser issue, an API timeout, or a bad fixture setup. If the logs capture the sequence clearly, the team can narrow down the failure without opening every artifact manually.
Example
Scenario: A login test passes consistently on developer's machines but fails only in the CI pipeline.

14:08:02.341 INFO Starting Test
14:08:04.521 INFO Opening Login Page
14:08:07.216 INFO Entering username
14:08:07.884 INFO Entering password
14:08:08.542 INFO Clicking Sign In
14:08:09.118 WARN Authentication service response time: 12.4 seconds
14:08:19.675 ERROR Login request timed out after 10 seconds
14:08:19.681 INFO Retrying authentication...
14:08:30.044 ERROR Second authentication attempt failed
14:08:30.052 ERROR Test Failed

Investigation: The test logic is identical in both local and CI environments. CI logs consistently show slower authentication response times. Infrastructure monitoring reveals the shared CI environment experienced high network latency during execution.
Increasing the request timeout and investigating the CI network resolved the issue.

Root Cause: The application code was not broken. The failure was caused by network latency in the CI environment, which delayed authentication responses beyond the configured timeout.
This format is useful because it ties the failure directly to the execution step and the probable system issue behind it. Logs become even more valuable when they are consistent across teams and environments.
Alert-based observability
Alert-based observability is about notifying the right people when a problem needs attention. Alerts can trigger when the failure rate crosses a threshold, when a critical test starts failing repeatedly, or when pipeline duration suddenly increases.
Use this type when delays are expensive. If a release pipeline starts failing at 2 a.m. or a critical smoke test begins breaking after deployment, alerts help the team respond before the issue spreads. The goal is not to alert everything, but to alert on the signals that matter most.
Alerts are especially useful in shared environments. QA may notice a test issue, but DevOps may own the pipeline, and developers may own the application service. An alert helps everyone react quickly without waiting for someone to notice the problem during manual review.
Example
Scenario:
A regression suite normally completes in 22 minutes.
One morning, the CI pipeline takes significantly longer than usual.
Regression Pipeline Monitoring
Normal Duration: 22 minutes
Current Duration: 51 minutes
Configured Threshold:
Pipeline duration > 35 minutes
🚨 Performance Alert Triggered

Investigation
No additional tests were added.
Traces show every test is waiting longer for page loads.
Infrastructure monitoring reveals the shared database CPU usage is above 95%.
The slowdown is caused by another team's heavy data migration running at the same time.

Root Cause:
The application itself was healthy. The increased pipeline time resulted from shared database resource contention, not a problem with the automation framework.
This is important because alerts turn observability into action. Without alerts, teams may only discover the issue when someone manually checks the dashboard.
Trace-based observability
Trace-based observability uses execution traces to show exactly what happened during a test run. A trace can reveal the sequence of actions, DOM state, network activity, screenshots, and timing details. For Playwright, trace data is especially valuable because it helps teams see a failure in context rather than only reading a stack trace.
Use this type when you need detailed debugging information. Traces are ideal for flaky UI failures, timing issues, and cross-browser behavior differences. They help teams understand the browser state before and after each step, which makes them one of the most practical observability tools for modern test automation.
Trace data is also great for sharing. When one engineer sees a failure, another engineer can inspect the same trace and understand the exact browser state without rerunning the test immediately. That speeds up collaboration and avoids repeated debugging work.
Example
Scenario: Flaky "Add to Cart" Test
A retail application intermittently fails with:
Error: locator.click: Element is not receiving pointer events


Trace Timeline
09:42:10.114 Navigate to product page
✓ Success
09:42:11.027 Product details loaded
09:42:11.314 Promotional banner animation started
09:42:11.418 Attempt to click "Add to Cart"
09:42:11.419 Click intercepted by promotional banner
09:42:11.420 Screenshot shows banner covering the button
09:42:11.998 Banner animation completed
09:42:12.002 Button became clickable

What the Trace Shows The button locator was correct. The element existed in the DOM. A temporary promotional banner animation covered the button for about 600 ms. The click happened while the button was visually blocked.
Root Cause: A UI animation temporarily overlaid the button, making it non-interactive. The trace proves the issue is a frontend synchronization problem, not a locator issue.
This kind of trace-based evidence is often the fastest way to explain flaky browser behavior. Instead of guessing, the team can inspect the recorded flow and fix the real problem.
Final recommendations
Building observability for test automation is one of the best ways to make QA pipelines more reliable, scalable, and easier to debug. If you combine metrics, logs, and alerts with trace-level visibility, you get a much clearer picture of what is happening inside your automation system.
The best place to start is with a small set of high-value signals: failure rate, execution time, retry count, and critical failure alerts. From there, add structured logs and trace-based inspection so your team can move from symptoms to root causes faster. If you are building or improving a growing test platform, observability is not just useful — it becomes part of the foundation.
A practical rollout usually works best in stages. First, define the signals that matter most to your team. Next, make sure those signals are visible in one place. Then, create alerts for high-priority failures and use traces or logs to investigate patterns. That step-by-step approach keeps observability manageable while still giving you the benefits of better visibility and faster debugging.
Witness how our meticulous approach and cutting-edge solutions elevated quality and performance to new heights. Begin your journey into the world of software testing excellence. To know more refer to Tools & Technologies & QA Services.
If you would like to learn more about the awesome services we provide, be sure to reach out.
Happy Testing 🙂