
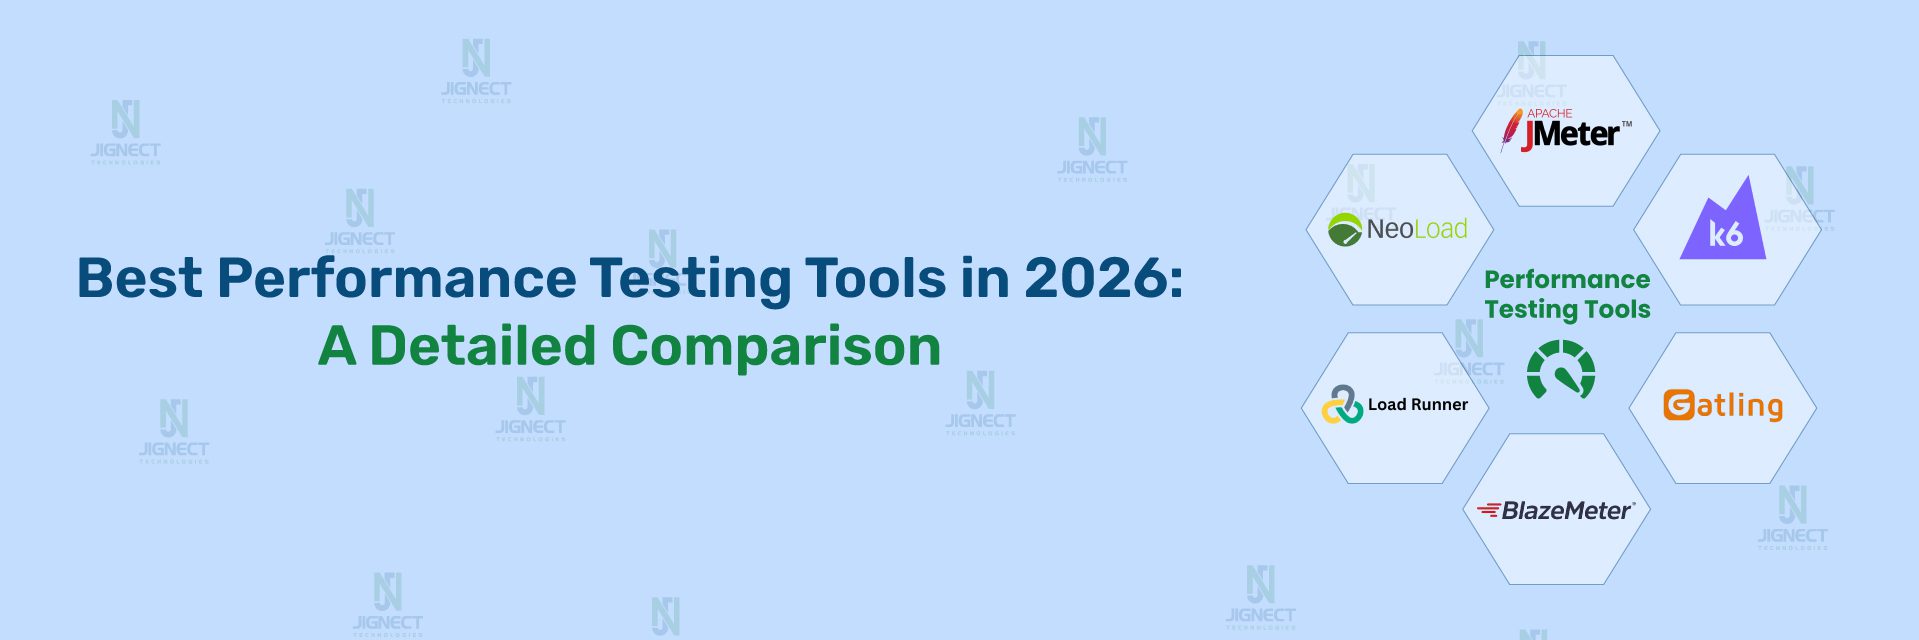

We live in a world where users expect everything to work instantly. Even a delay of a few seconds can make someone close your app or website and never come back. For businesses, that’s not just frustrating it directly impacts revenue. Imagine an online store slowing down during a big sale that can translate into massive losses in minutes.
That’s why performance testing matters so much today. It’s not just about speed; it’s about making sure your application stays reliable, consistent, and responsive even under pressure. When teams test early and simulate real-world usage, they can catch issues long before users ever experience them.
In this article, we’ll break down what performance testing really means, why the right tool matters, and compare some of the top performance testing tools in 2026 to help you choose what fits your team best.
Understanding Performance Testing
What is Performance Testing
Performance testing examines how an application behaves once genuine pressure builds. It focuses on speed, responsiveness, stability, and the system’s ability to stretch as demand changes, exposing strengths and weak points that routine checks rarely uncover. Functional testing confirms a feature behaves correctly, but this type of testing digs into more demanding questions that shape daily operation.
- How quickly does the system answer during routine activity?
- Can it absorb a sudden traffic spike without stalling?
- Where do slowdowns appear once the system is pushed harder than usual?
- Does performance fade gradually during long periods of use, maybe so quietly that no one notices at first?
Importance in Modern Software Development
Modern software moves fast, and users walk away the moment an app drags or freezes. Performance testing becomes a practical safeguard in this kind of environment, shaping how teams maintain reliability and plan ahead.
- Enhancing User Experience: Fast, steady systems keep users around longer and raise overall satisfaction, something product teams track closely.
- Reducing Downtime: Identifying problems early reduces downtime, since it uncovers issues long before they leak into the production environment and spell bigger trouble.
- Optimizing for cost: Tuning resources on CPU, memory and bandwidth ensure that operations cost stays lean, you are not purchasing hardware to which parts of resources go unutilized.
- Scalability Planning: These tests shape long-term scaling choices too, especially when traffic jumps during major events or during those strange seasonal waves that often hit without warning.
For example, think of a banking system processing thousands of transactions every second. Without proper performance testing, even a small spike could lead to failed transactions or data issues.
Common Types of Performance Testing
Performance testing isn’t a single fixed method, and the approach shifts based on testing goals and how the system is expected to be used. Different patterns of demand call for different techniques.
Load Testing
Load testing reproduces the usual number of users or transactions to confirm the system behaves normally under everyday pressure. It keeps an eye on how fast responses come, how much gets processed, while showing total resource use – so teams can tell if the app handles regular tasks smoothly instead of slowing down.
Example: A retail website anticipates 10,000 parallel users during a sale – load testing verifies that the site stays up and responsive.
Stress Testing
Stress testing forces a system past its limits to find where things fall apart. When pushed hard, you see if it crashes badly or bounces back without losing data.
Example: Gradually increasing traffic until a server crash to observe its recovery behaviour.
Spike Testing
Spike testing evaluates system performance under sudden, extreme spikes in traffic. It is useful for apps that may experience viral usage or flash sales.
Example: A ticketing website experiences a sudden surge of users during a popular concert ticket release.
Endurance (Soak) Testing
Endurance testing runs the system at usual load over extended periods – this uncovers problems piling up slowly, like memory leaks or slipping performance, one’s brief checks usually miss.
Example: Running a 24-hour test on a CRM system to ensure consistent performance throughout.
Scalability Testing
Scaling tests check if a system handles more load when needed, so teams get real numbers to shape their setup – no guessing involved. This helps spread out power where it’s actually required.
Example: Testing an API backend to handle double the expected traffic without slowing down.
Why Performance Testing Tools Are Critical
Manual testing simply can’t keep up with modern systems. You can’t realistically simulate thousands of users or measure precise performance metrics by hand.
Performance testing tools solve this by:
- Simulating real-world user traffic
- Measuring system performance accurately
- Identifying bottlenecks quickly
- Providing clear, actionable insights
Without these tools, critical issues can easily go unnoticed until they affect real users.
The Challenges of Manual Testing
Testing by hand just doesn’t work well with today’s apps. Trying to mimic hundreds of users at once isn’t doable, while people doing tests tend to slip up now and then. Getting exact numbers on speed, load handling, or delays? Nearly impossible without software that handles it automatically.
Getting the same bugs to show up every time isn’t always easy – some only pop up when the systems under heavy use. On top of that, putting together clear reports that point out weak spots takes a lot of effort, plus results often vary. Because of this, serious problems might go unnoticed longer, which raises the chance something could crash once it’s running live.
Key Features of Performance Testing Tools
Performance testing tools tackle weak spots in hands-on checks thanks to smart features like:
- User Traffic Simulation: Create tons of fake visitors fast – see how systems handle real-world pressure. Use loads of simulated folks to check performance when things get busy. Try it with small groups or huge crowds – it works either way.
- Detailed Metrics Measurement: Helps monitor response speed, data flow, delays, CPU load, memory use – also how much network capacity is used.
- Bottleneck Identification: Spot sluggish queries fast – also catch memory hogs, thread clashes, or weak spots dragging performance down.
- Automated Reporting: Makes charts, logs or dashboards showing useful info for dev’s and testers.
- CI/CD Integration: Checks right inside your workflow – spot problems fast while building or rolling out updates. Instead of waiting, catch glitches on the fly through automated runs each time code changes.
Benefits of Using the Right Tool
Choosing the right performance testing tool can make a big difference:
- Efficiency: Run big tests over again fast, yet don’t spend ages doing them by hand.
- Reliability: Detect hidden issues before they affect real users, ensuring smoother application performance.
- Cost Savings: Cut costs by avoiding extra resource use while lowering risks of sudden crashes or outages.
- Actionable Insights: See how the system acts in different situations – this helps you choose smarter moves when improving or expanding.
Top Performance Testing Tools in 2026
1. Apache JMeter
Best For: Conducting authentic load testing of your web applications, APIs, and databases.
Overview: JMeter reigns as the self-proclaimed king of the free and open-source realm of performance testing. Simple it may seem, but no, it actually isn’t. A highly adaptable foundation integrating effortlessly into contemporary development ecosystems (say, CI/CD!). Your litmus test for whether your app can make it to the pros.
Key Features:
- Anything you toss at it do it: from taking the KO sites down to cooking the APIs without a of a spit and the kitty litter to cook (saving totally less than a tenth of a second to give a rat’s ass).
- Automation Prepared: Execute your performance tests all computer-less in Command Line Interface (CLI) mode. Ideal for your ongoing testing environment.
- CI/CD synergy: Seamlessly compatible with Jenkins et al., turning performance validation into an automatic, part of every code roll-out.
- Revealing Findings: Receive comprehensive charts and documentation that make the hidden choke points obvious.
Pros:
- Totally Costless: 100% open-source, so you don’t have to pay_license_fees!
- Community Backbone: If you got an issue, someone else done had it too. The discussion boards are a priceless tool.
- Universal Compatibility: Runs seamlessly on all operating systems – Windows, Mac, and Linux.
Cons:
- It is a Resource Hog: Is your test very large? The GUI maybe a little bit of a memory guzzler.
- Learning Curve Steeper: It’s a strong one for sure, but the power is not obvious. Beginners will probably have to invest some time in understanding the basic principles.
2. LoadRunner
Best For: Enterprise-scale performance checks work well here, particularly when dealing with older or custom communication methods.
Overview: LoadRunner goes beyond being merely software – it acts like a full-scale lab for mimicking heavy, lifelike traffic across intricate systems using many communication types. Big companies rely on its sharp, detailed insights before giving approval to roll out huge applications. What stands out? The precision it offers when stakes are high.
Key Features:
- Protocol Master: This is where LoadRunner shines. It supports a staggering range of protocols over 50! This includes standard HTTP/S but also highly specific protocols like SAP, Citrix, and Oracle, making it ideal for testing packaged enterprise applications.
- See It Live: Right now, watch everything unfold as it happens. A clear picture of how your system is doing shows up instantly through live tracking. Spot issues before they grow, without sitting around waiting for results to come in later.
- Performance monitoring: You don’t have to wait for the test to finish to spot a problem.
- Deep Diagnostics: It offers comprehensive, in-depth analytics and reporting that lets performance engineers quickly identify and pinpoint the exact server-side bottlenecks.
- Automation Ready: Like all modern tools, it integrates smoothly into your CI/CD pipeline for automated, continuous testing.
Pros:
- Unmatched Scalability: It is built from the ground up to handle massive, geographically distributed user loads without breaking a sweat.
- Comprehensive Support: Excellent analysis, reporting, and enterprise-level customer support come standard.
- Protocol Versatility: It’s the go-to choice for complex, multi-protocol, and legacy environments that simpler tools can’t touch.
Cons:
- The Price Tag is High: LoadRunner is a commercial tool, and the licensing costs, particularly for high virtual user counts, can be very expensive.
- Expert Required: Due to its immense power and complex features, there’s a definite learning curve. You need experienced performance testers to use it effectively.
3. K6
Best For: Modern, developer-first performance testing that slides right into your CI/CD pipelines without a hiccup.
Overview: k6 steps in as the cool, cloud-friendly, JavaScript-powered contender in the performance testing arena. Don’t let the minimalist look fool you this tool means business. Built by dev’s for dev’s, it executes lightning-fast load tests with code-first precision while pairing beautifully with Grafana for eye-pleasing real-time insights.
Key Features:
- Code-Native Power: Write test scripts in pure JavaScript no XML nightmares, no drag-and-drop fairy tales.
- Cloud Superpowers: Run scalable tests directly through k6 Cloud without begging infra teams for machines.
- Grafana Magic: Stream live test metrics into gorgeous dashboards that make bottlenecks glow like neon signs.
Pros:
- Developer Heaven: Script-friendly, Git-friendly, CI/CD-friendly it fits right into modern workflows like it was born there.
- Long-Run Warrior: Excellent for endurance tests and keeping an eye on system health over extended periods.
- Visual Delight: Clean, crisp, real-time charts that don’t need a data scientist to decode.
Cons:
- CLI-Only Life: No GUI to click around in the command line is your only date here.
- Web-Lean Muscle: Not ideal if you’re targeting non-HTTP or deeply protocol-specific systems.
4. Gatling
Best For: Code-loving developers who prefer crafting performance tests like they craft their APIs clean, scripted, automated, and CI/CD-ready.
Overview: Gatling enters the arena as the performance-testing sniper: precise, code-first, and insanely fast. Powered by Scala and Akka under the hood, it’s built for teams who think scripting is a superpower, not a chore. No bulky interfaces here just pure developer-driven flow.
Key Features:
- DSL Wizardry: Script tests using Gatling’s elegant Scala-based DSL or tap into the Gatling Enterprise GUI if you want a sprinkle of visuals.
- Pipeline Native: Plays perfectly with Jenkins, GitHub Actions, GitLab, and pretty much any CI/CD system that speaks “automation.”
- Get results fast: Clean HTML updates right away, so slowdowns show up instantly. No waiting around.
Pros:
- Lightweight & Fast: Designed for speed and dev efficiency.
- API & Web Testing Beast: Thrives in heavy request-per-second scenarios.
- DevOps Soulmate: Built to be automated, version-controlled, and pipeline-approved.
Cons:
- Code Required: Requires coding knowledge. L
- Protocol Limitations: Not as wide-ranging as some heavyweight enterprise tools.
5. NeoLoad
Best For: Great if you’re a business or group needing an easy-to-use, growing-friendly tool that tests how well your API, website, or small service handles traffic – built for smooth scaling without complexity.
Overview: NeoLoad shows up looking sharp – think reliable tool that handles cloud or local setups just fine. Built for teams using fast-paced development styles, it mixes easy-to-follow visuals with solid scripting power. Need big tests you can run again without rebuilding each time? It steps in here; imagine smart tech doing the heavy lifting instead of a person.
Key Features:
- Auto-Test Magic: Record traffic and watch NeoLoad generate tests faster than you can say “manual scripting, who?”
- Live Insights: Real-time dashboards and analytics let you catch bottlenecks before they cry for attention.
- Cloud Muscle: Fire up massive load tests in the cloud without begging IT for servers.
Pros:
- Easy to use: Needs little coding – great for test folks or coders, whichever you are.
- Scales Like a Boss: Handles large, complex scenarios effortlessly.
- Cloud-Ready: Native support for cloud infrastructure keeps performance testing future-proof.
Cons:
- Price Tag Alert: Paid licensing might pinch if your budgets tight.
- Overkill Risk: Small projects may not need all this firepower it’s a tool built for scale.
6. BlazeMeter
Best For: Your crew wants big-time cloud testing – yet still uses JMeter every day.
Overview: BlazeMeter jumps in like a turbocharged version of JMeter, running heavy tests across machines with zero hassle. Live data tracking hooks up smoothly with CI/CD pipelines while tests fire off from multiple locations at once – perfect for big teams needing JMeter’s muscle but faster, cloud-based agility.
Key Features:
- JMeter DNA: Works straight with your old scripts – no changes needed, plus no stress.
- Cloud power: Run huge tests across many spots – no setup needed.
- CI/CD Buddy hooks right into your pipeline: Automating tests so they run smooth every time, while keeping setup simple. Instead of manual checks, it brings consistency without extra hassle.
Pros:
- Grow endlessly: Tackles scattered, big company demands without breaking a sweat.
- Smart number-crunching: Detailed reports plus slick visuals so delays show up fast.
- Cloud made easy: No servers, no setup hassles, or hands-on adjustments – BlazeMeter handles everything.
Cons:
- You’ll need a subscription: It’s not free. Cloud features cost money.
- Works poorly without internet access: features are restricted when offline.
Quick Comparison Table
| Tool | Type | Best For | Key Strengths | Cost | Ease of Use |
| JMeter | Open Source | Web & APIs | Extensible, community-driven | Free | Moderate |
| LoadRunner | Commercial | Enterprise apps | Wide protocol support | $$$ | Intermediate |
| NeoLoad | Commercial | CI/CD & Agile teams | Automation & DevOps integration | $$ | Easy |
| Gatling | Open Source | Developer-oriented testing | High performance scripting | Free / $$ | Harder |
| BlazeMeter | Commercial | Cloud-based testing | Scalable, easy deployment | $$ | Easy |
| k6 | Open Source | APIs & microservices | CI/CD & Grafana integration | Free / $ | Easy |
This comparison shows how top performance testing tools differ. While open-source options such as JMeter, Gatling, or k6 suit dev’s and small teams, they offer scripting freedom – alongside CI/CD links – usually free.
Meanwhile, big-team tools such as LoadRunner or NeoLoad handle many protocols, deep insights, also heavy-duty load tests – yet need paid licenses plus trained staff. BlazeMeter fills the middle ground using cloud-powered, JMeter-friendly runs alongside quick scaling but live feedback.
How to Choose the Right Tool
Picking a good performance testing tool matters – it affects how reliable your tests are, how fast you can run them, maybe even how well they fit into your team’s routine. What works best changes based on things like how big your group is, what skills people have, the kind of app you’re building, how much load you need to simulate, or whether you use automated pipelines.
1. Based on Team Size and Expertise
The size of your team – along with its skills – plays a big role when picking tools:
- Small Teams: Small groups often have tight budgets or rely on dev’s to handle tests – so free options such as JMeter, k6, or Gatling make sense. They don’t cost much, adapt easily, work smoothly with build systems, but you’ll need some coding skills. However, setup might take effort if your crew lacks experience.
- Large Enterprises: Big companies often use heavy-duty tools like LoadRunner or NeoLoad when building complicated systems. Because these platforms handle deep analysis, cover many communication types, yet demand skilled users plus paid licenses – teams must plan carefully before adopting them.
2. Based on Application Type
The kind of app you’re testing shapes your pick too – so does what it’s meant to do:
- Web Applications: Web apps? JMeter or Gatling work great – test APIs under stress, mimic real users in browsers. These tools handle heavy traffic checks while acting like actual visitors online.
- Mobile Applications: Mobile apps need performance checks that mimic weak signals or slow internet – so tools like NeoLoad or BlazeMeter work better. These platforms run tests on actual phones plus use cloud systems to scale quickly. Their built-in features handle phone-specific issues smoothly without extra setup steps.
- Enterprise Applications: Big business apps usually need support for many protocols along with deep insights – so folks tend to go for LoadRunner.
3. Cloud & Global Testing
When apps are used around the world, tools such as BlazeMeter run tests from various regions. That way, there’s no reliance on actual devices placed everywhere – instead, groups can mimic live user activity across distant areas at once.
4. DevOps Integration & Automation
Continuous integration plus delivery needs tools fitting smoothly into automatic workflows:
- NeoLoad works well for developers, also k6 does – both fit smoothly into CI/CD pipelines to run performance checks automatically.
- This way, problems show up sooner – so fixes happen quicker while cutting down surprises later on.
5. Pilot Testing and Evaluation
Try it on a smaller level first – it’s smart to test before jumping in. Testing early gives you clues about how well things might work:
- Simple to start using yet tricky to master
- How well the reports work . How clear the data looks
- Integration with existing CI/CD workflows
- Help with needed rules plus check routines
Looking at these points helps teams pick a testing tool that fits how they work, what they know, the app they’re using, or their project aims. Picking wisely boosts test speed while making sure the app runs smoothly under pressure.
Final Thoughts
Performance tests aren’t extra anymore – they’re essential to build solid software that users like and companies need.
Performance Testing as a Competitive Advantage
Performance tests aren’t only about spotting slow spots – they actually help the company win. Apps that handle heavy traffic without crashing:
- Keep people using your app – slow performance annoys them, so they might leave. Fast apps make folks stick around longer.
- Keep money coming in – when sites like online stores, banking apps, or subscription tools slow down or fail at busy times, they risk big losses.
- A solid app shows you mean business – users trust it more when it works well.
Testing early helps companies spot problems before customers do – making it a smart move instead of just routine work.
Matching Tools to Project and Team Goals
Picking the right tool matters just as much as running the test. Go with what fits your project’s reach, how big your crew is, their tech know-how – also keep an eye on costs:
- Open-source tools like JMeter, Gatling, or k6 work well for small teams that need to save money. These tools give you freedom to customize, let you write scripts, also fit into automated workflows – though they do demand some tech skill to use properly.
- Commercial tools such as LoadRunner, NeoLoad, or BlazeMeter come with deep insights, strong backing for big teams, alongside wide-ranging protocol handling – so they fit well with tough, high-stakes setups.
Matching the tool to your team’s skills and what you aim to build makes tests work better, so results actually help boost how well the app runs – all while staying practical.
Best Practices: Test Early, Test Often
To maximize the value of performance testing:
- Start early: add speed checks while building, not just at the end.
- Test continuously: run automatic checks often through your build flow so issues pop up fast.
- Monitor production: once it’s live, watch performance closely so you can spot hiccups before they grow. Check regularly – this helps dodge surprises later down the line.
Sticking to these tips helps teams build apps that work well while staying tough, quick, and able to grow – giving users a smoother ride while boosting results for the company.
Conclusion
In short, checking how well software runs matters if you want it to work smoothly for users and meet company needs. Because real-life use gets mimicked, weak spots found, system tweaks made, apps stay quick, steady, even when traffic spikes. Picking the correct tool – say, free tools like JMeter, Gatling, or k6 for small squads; heavier-duty picks like LoadRunner, NeoLoad, BlazeMeter for bigger setups – keeps tests useful, doable, on track with what the project actually requires.
Focusing on speed checks sooner in building apps, keeping tests going nonstop, while watching how things run live turns fixes into smart planning. Apps that load quick keep people around, save money, also boost how others see your name – so checking performance isn’t only about tech, it’s staying ahead when everything online moves at full throttle.
Witness how our meticulous approach and cutting-edge solutions elevated quality and performance to new heights. Begin your journey into the world of software testing excellence. To know more refer to Tools & Technologies & QA Services.
If you would like to learn more about the awesome services we provide, be sure to reach out.
Happy Testing 🙂


