

Introduction to JMeter
Apache JMeter is a free and open-source tool adapted for load testing and measuring the application’s performance. It’s a flexible platform with the capability to analyze web applications, perform functional tests, and evaluate the performance of database servers. JMeter is a Java desktop application with a graphical interface built with the Swing graphical API. This allows it to run on any environment or workstation that supports a Java virtual machine, including Windows, Linux, Mac, and more. JMeter creates user groups that generate requests to networks or servers, following, providing statistical data analysis through easily understandable visuals and diagrams.
Use of JMeter in Software Testing
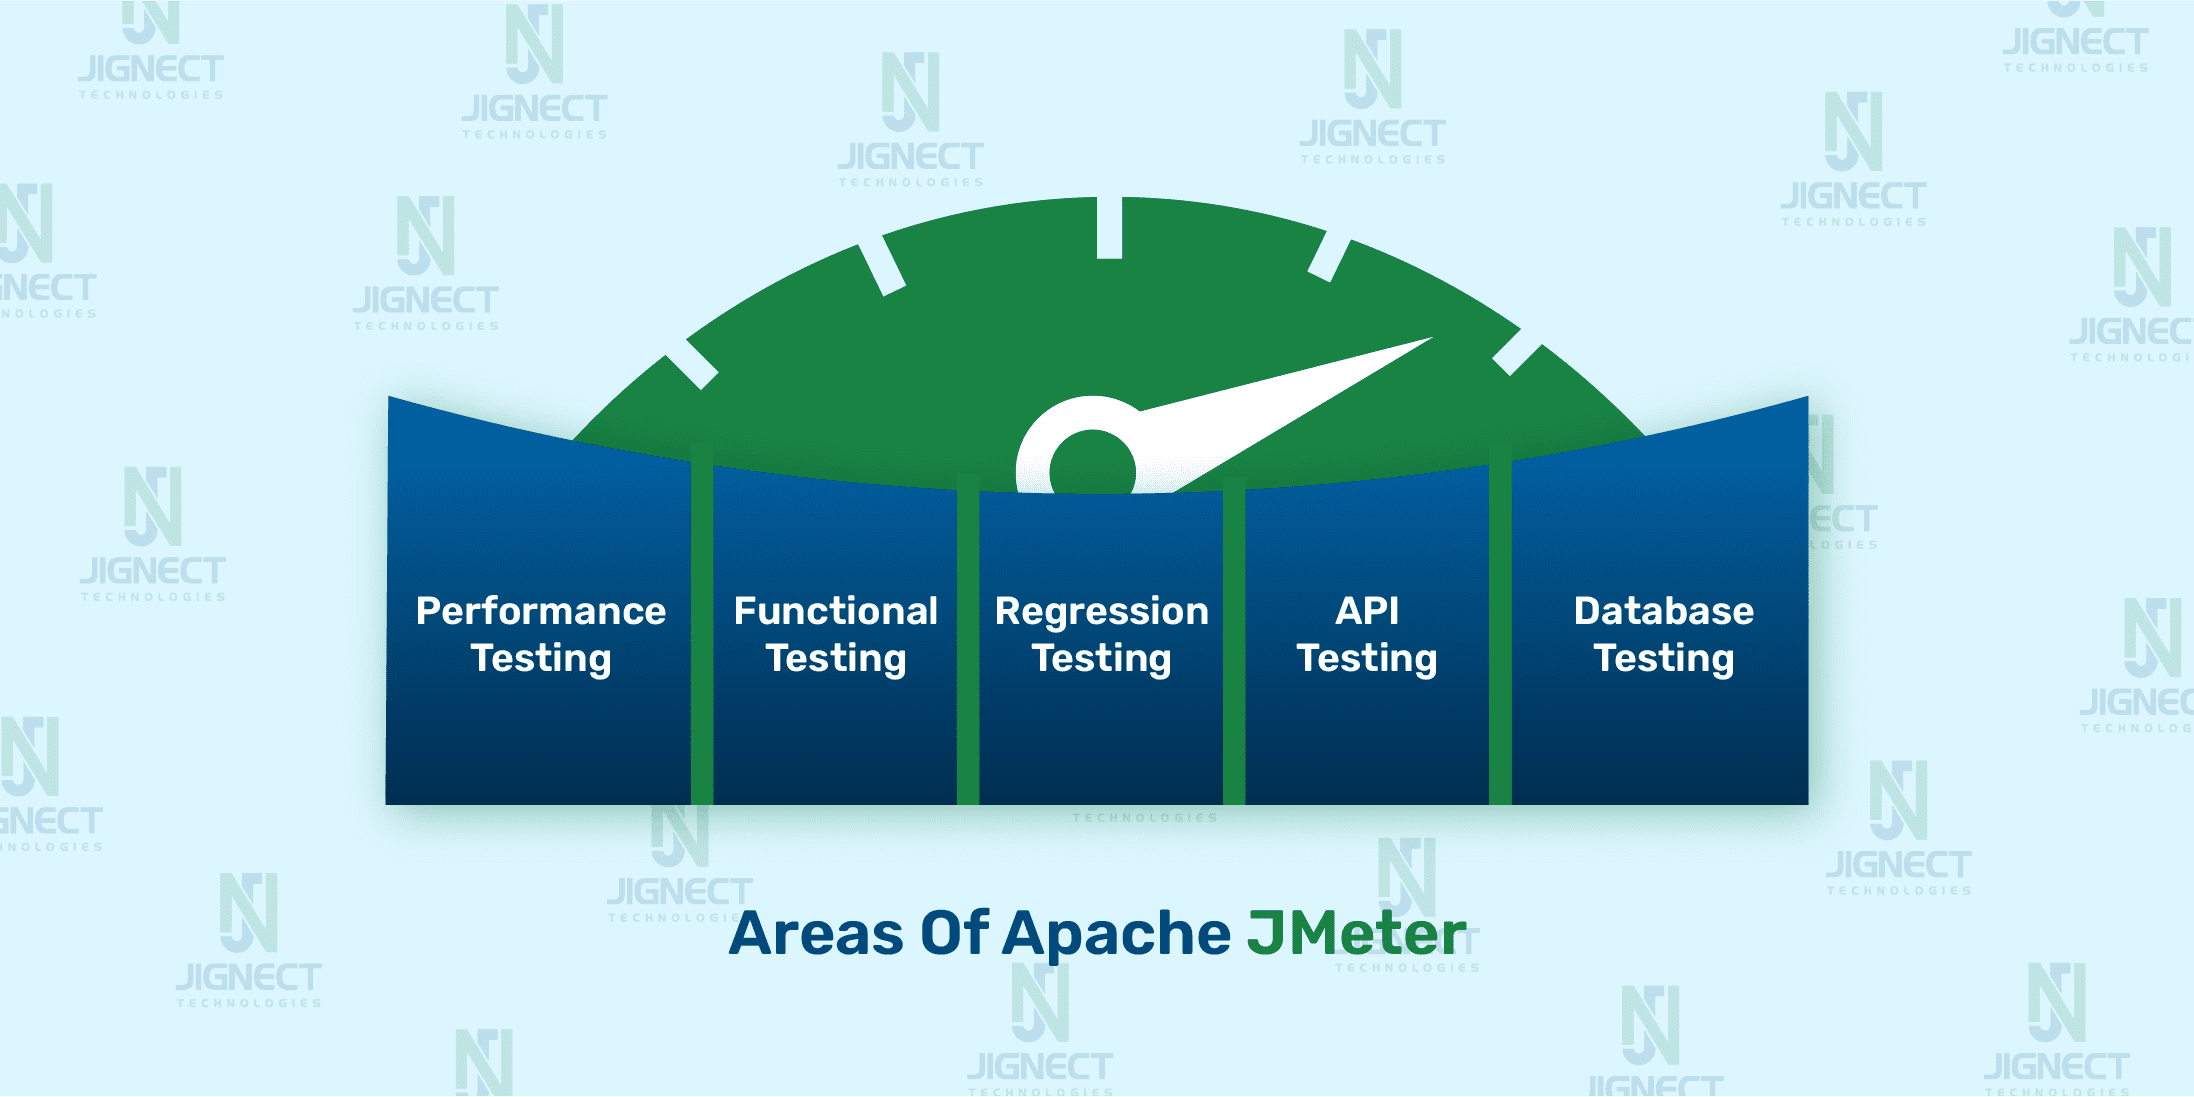
Areas Of Apache JMeter
Apache JMeter is a popular tool used for testing software applications, especially websites and web services. But it does more than just test performance; it can also check how well the software functions. Let’s dive into how JMeter is used in software testing.
- Performance Testing: This is where JMeter shines. JMeter allows testers to replicate different types of loads on a server, such as multiple users accessing the application at the same time, to measure its performance measures like response time, throughput, and resource utilization.
- Load Testing: Load testing involves applying a load to a system to see how it behaves under different levels of stress. With JMeter, you can replicate a large number of users accessing your application simultaneously to identify performance constraints and determine the maximum load your system can handle.
- Stress Testing: Stress testing involves testing a system beyond its normal operational capacity to observe how it behaves under extreme load conditions. With JMeter, you can gradually increase the load on the system until it reaches its limits or starts to show signs of instability or decreased performance
- Functional Testing: Even though JMeter is mainly used for performance testing, we can also use it to test if the software does what it’s supposed to do. With JMeter, you can create test scenarios that replicate user actions and verify that the application functions as expected.
- Regression Testing: Regression testing in JMeter ensures that changes made to your application haven’t unintentionally broken existing functionalities. JMeter is a valuable tool for automating regression testing and ensuring the stability of your application throughout the development phase.
- API Testing: In JMeter, API testing involves testing individual API endpoints, validating if response data is correct, along with status codes, headers, and other components of the API’s behaviour.
- Database Testing: Database testing with JMeter focuses on evaluating the performance and functionality of your database server. It simulates many users accessing the database at once and analyses how the database responds under load.
Features Of JMeter
- User-Friendly GUI: JMeter’s GUI provides a user-friendly interface for creating, managing, and executing test plans without the need for advanced programming skills.
- Platform Independent: Built-in Java, JMeter is platform-independent, enabling its deployment and usage across different operating systems like Windows, Unix, and Linux.
- Multi-Threading Support: With JMeter’s multi-threading, it can handle different tasks at the same time in a test plan. This helps make testing faster and more scalable, like when many users use the application together in real life.
- Protocol Support: It offers support for multiple protocols including HTTP, HTTPS, FTP, JDBC, SOAP, etc., enabling testing across different application environments.
- Scripting support: JMeter allows the writing of custom scripts using languages such as JavaScript or Beanshell to handle complex scenarios.
- Parameterization: Parameterization is the act of creating different data sets for different users in the same test script. It includes scenarios such as executing multiple users with different credentials within the same script.
- Assertions: JMeter offers a range of assertions that enable testers to verify if server responses satisfy predefined conditions. Assertions can be used to check response codes, response content, response times, and more.
- Reporting and Analysis: JMeter includes various listeners and reporting tools that allow testers to observe, test execution in real-time and analyze test results after the test is complete.
- Distributed Testing: JMeter supports distributed testing, allowing testers to run tests on multiple machines at the same time to simulate a large number of users accessing the application simultaneously. This helps to check the performance of the system under heavy loads
- Integration Capabilities: JMeter seamlessly integrates with various tools and frameworks like CI/CD pipelines and monitoring systems, making it easier to automate testing processes and improve development workflows.
- Record and Playback: JMeter’s record and playback feature acts like a screen recorder for your web application, capturing your interactions and converting them into a test script for efficient performance testing.
JMeter Elements
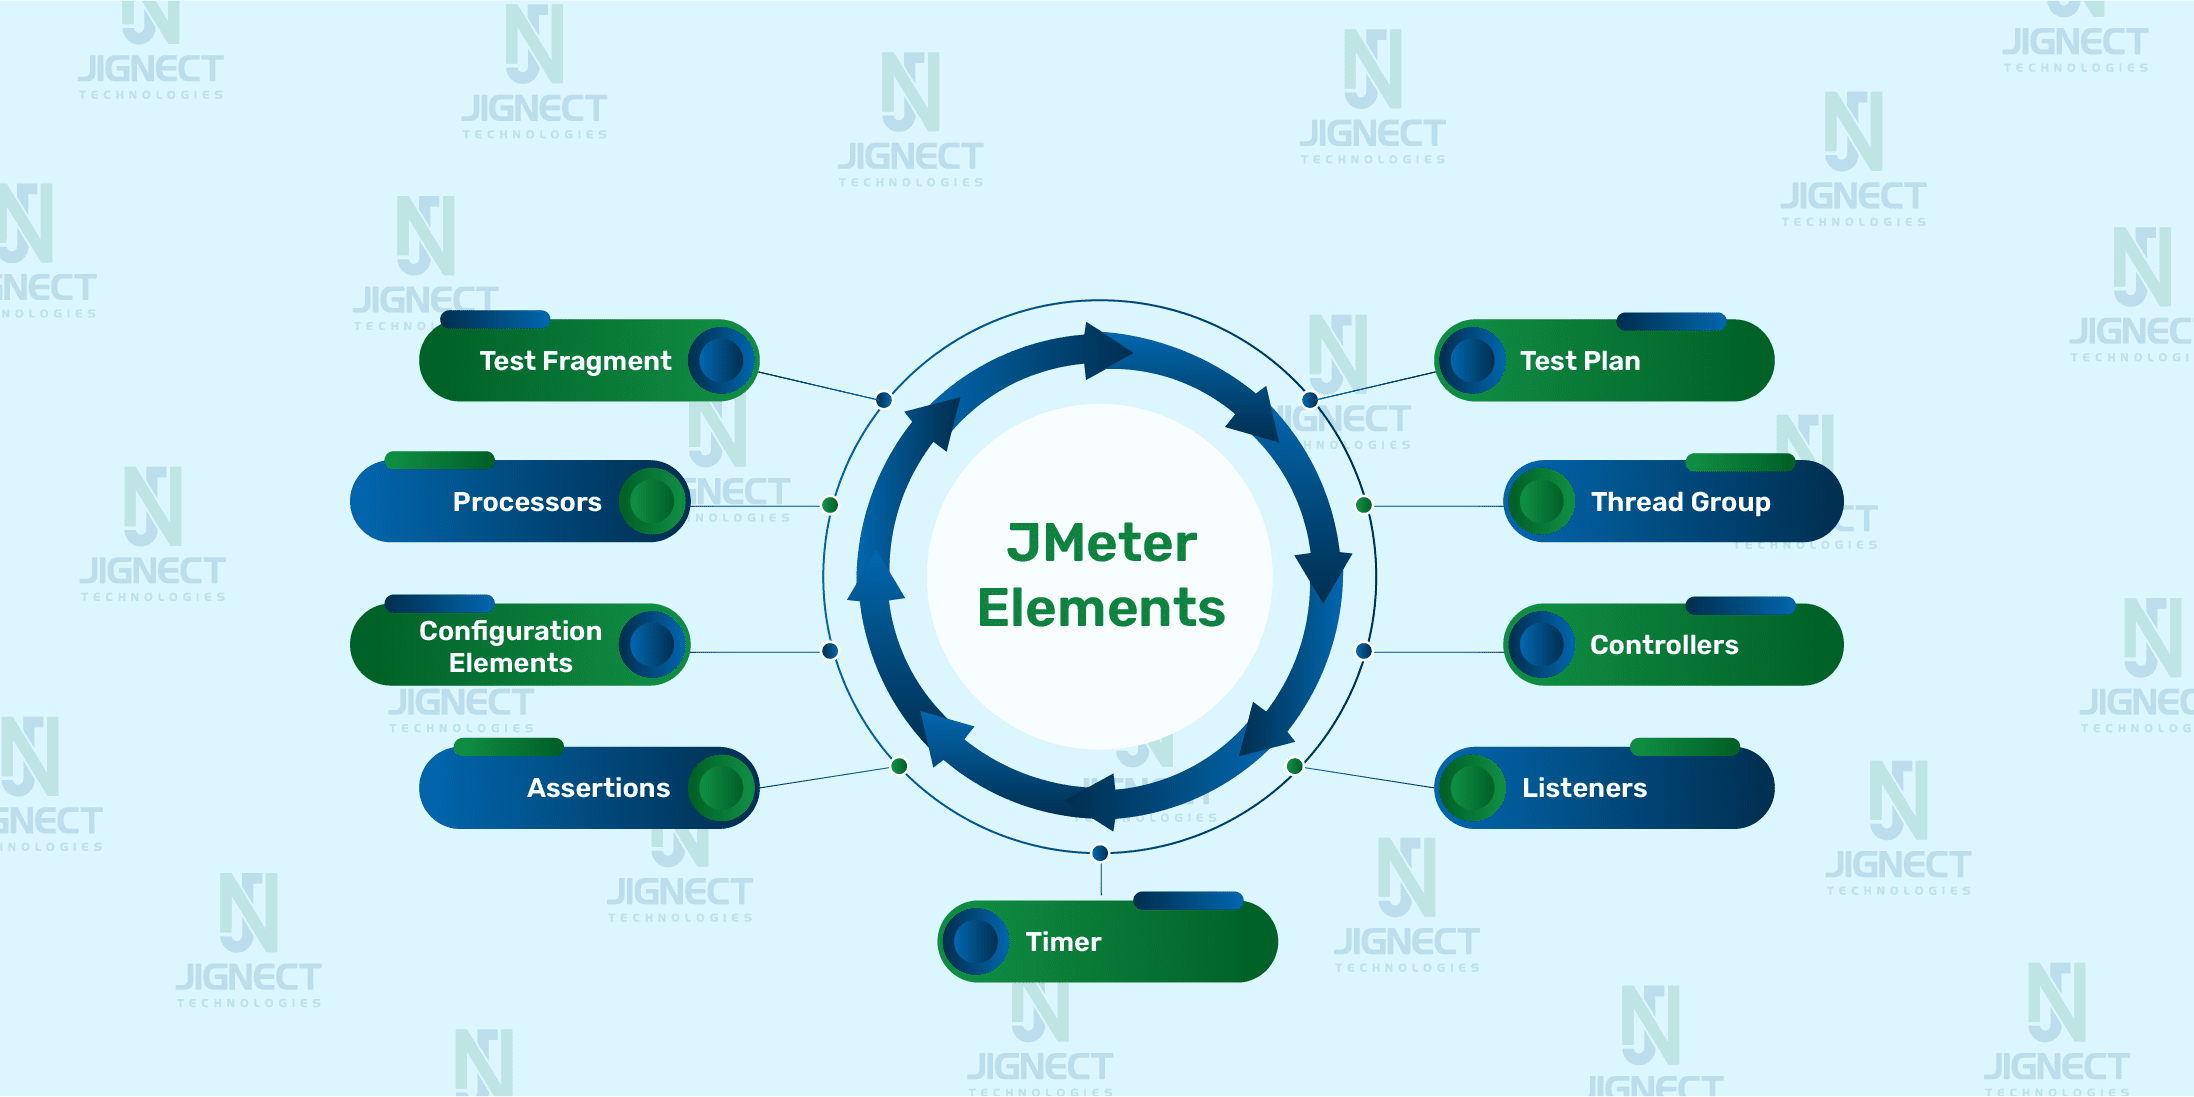
Test Plan
The Test Plan defines the steps JMeter will follow when running the test. It tells JMeter what to test (e.g., website, application) and how to conduct the test (e.g., specifying the number of users). All components included within a test plan are executed in a sequence, following either the top-to-bottom order or the sequence defined in the test plan. A complete test plan consists of one or more components like Thread Groups, logic controllers, sample-generating controllers, listeners, timers, assertions, and configuration elements. Every test plan should have at least one thread group.
Thread Group
The Thread Group is considered the starting point for all your test plans. The Thread Group in JMeter sets how many users you want to simulate in your test. When testing server-based applications, it’s common to have different situations they need to handle. So, by creating separate groups of threads for each situation, we can distribute the testing load more accurately.
Here’s how you can set up the Thread Group:
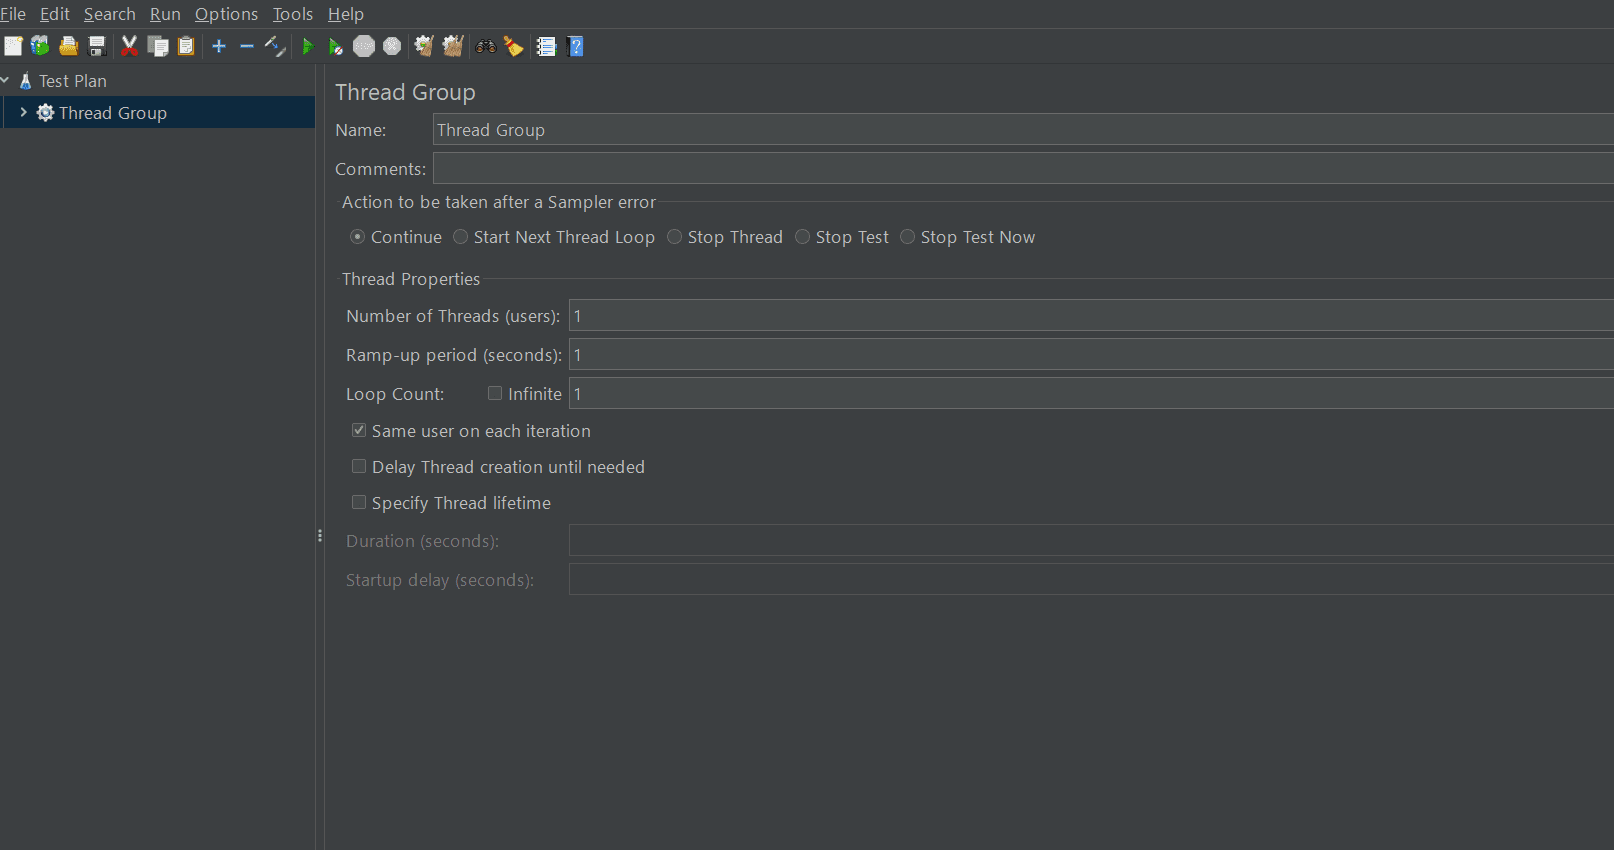
- Action on Sampler Error: Decides what happens when an error occurs during testing:
- Continue: Ignore errors and keep going.
- Start Next Thread Loop: Ignore the error, finish the current task, and move on to the next.
- Stop Thread: Stop the current task, but let others keep going.
- Stop Test: Stop the entire test once ongoing tasks are finished.
- Stop Test Now: Stop the test immediately, interrupting ongoing tasks.
- Number of Threads (Users): We can specify the number of virtual users doing the tasks simultaneously.
- Ramp-up Period (seconds): Time taken to start all threads. For example, you have 10 virtual users (threads) and a ramp-up period of 100 seconds. JMeter will gradually launch these users over 100 seconds. Each user will start 10 seconds after the one before it, ensuring a smooth increase in load.
- Loop Count: How many times each thread will repeat the tasks before ending.
- Delay Thread Creation until Needed: When enabled, it instructs JMeter to delay the creation of threads until they are needed for execution.
- Specify Thread Lifetime: Set how long the thread group runs:
- Duration: How long the test runs in seconds.
- Startup Delay: How long to wait before starting the test in seconds.
These settings help simulate multiple users accessing the server at the same time and control how the test behaves under different conditions.
Controllers
A ‘Controller’ in JMeter is a part of your test plan that controls how requests and actions take place in your script. It decides the order in which samplers (HTTP requests, FTP requests, JDBC requests, etc.) and other elements are executed during the load test.
JMeter has two types of Controllers − Samplers and Logic Controllers.
Samplers
Samplers in JMeter are added as a child of Thread Groups. Samplers in JMeter are components responsible for sending various types of requests such as HTTP, FTP, and JDBC to a server during performance testing. After the server processes the sampler request, JMeter receives the response, which can then be viewed and analyzed for various performance metrics such as response time, hits per second, throughput, and more.
Logic Controllers
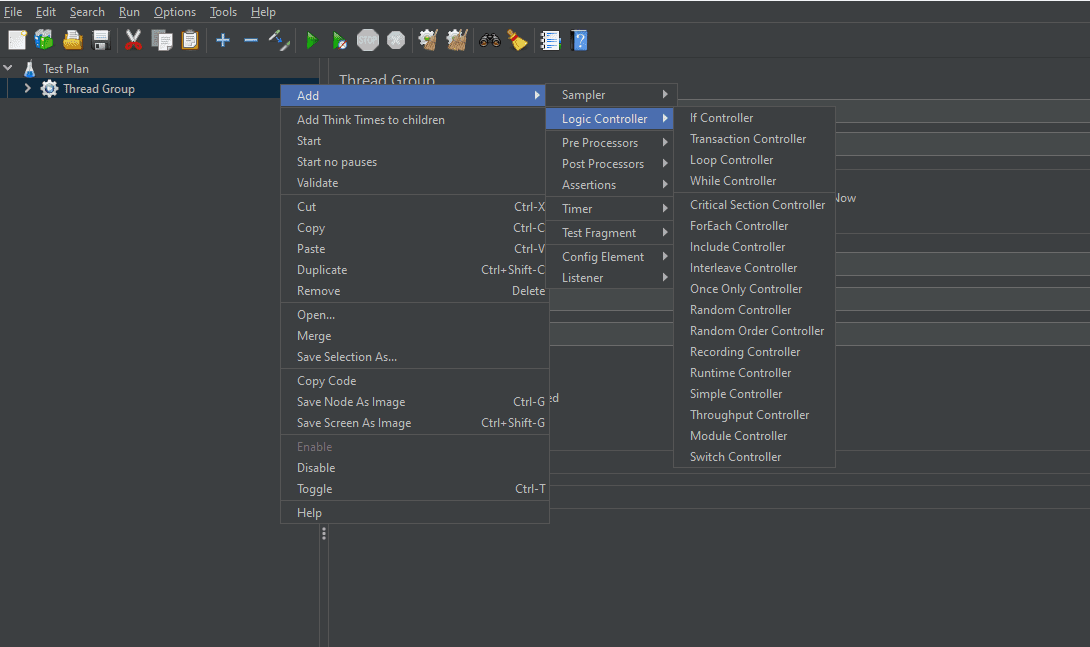
Logic Controllers in JMeter are elements used to control the flow of requests within a test plan. They allow testers to define the order and conditions under which samplers and other elements are executed during a test run.
Listeners
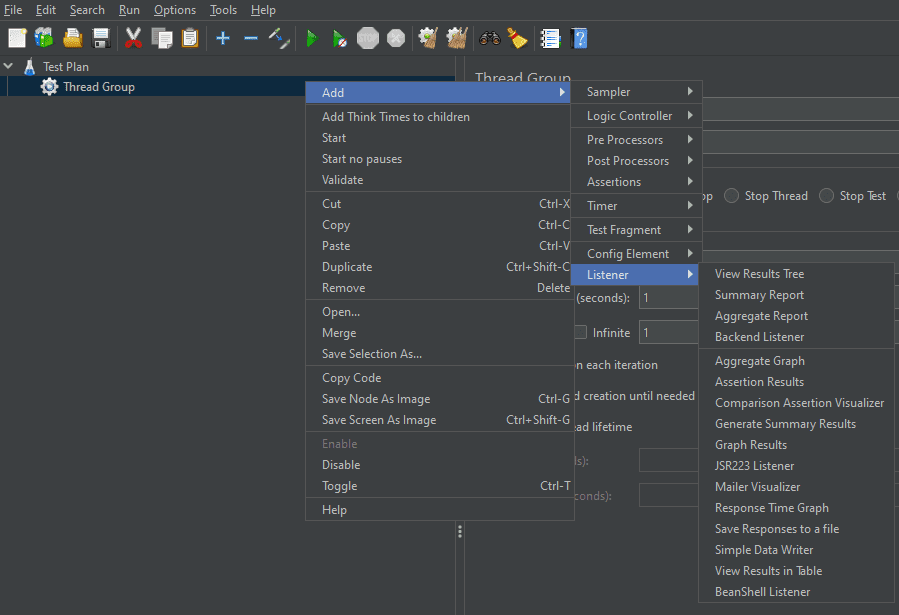
Listeners in JMeter are components that collect and display the results of performance tests. Listeners allow testers to monitor metrics like response times, throughput, errors, and other performance indicators during test execution. JMeter provides various types of listeners, such as View Results Tree, View Results in Table, Summary Report, Aggregate Report, etc.
Timer
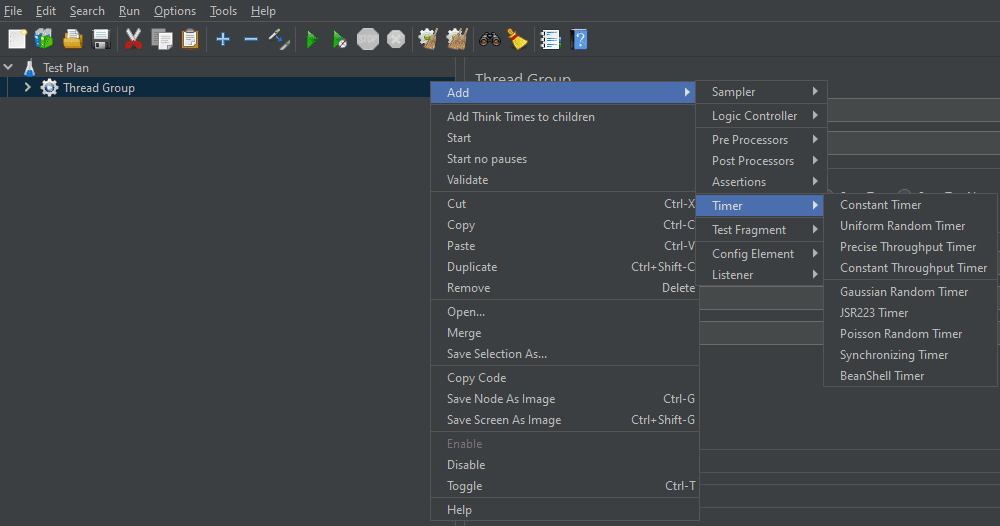
Timer in JMeter are elements used to introduce delays between the executions of Sampler requests. Timer can be applied at the Thread Group level, which applies them to all Samplers within that Thread Group, or directly to individual Samplers. Timer are particularly useful for load-testing scenarios where you want to replicate a more realistic user load on your system by introducing delays between requests.
Assertions
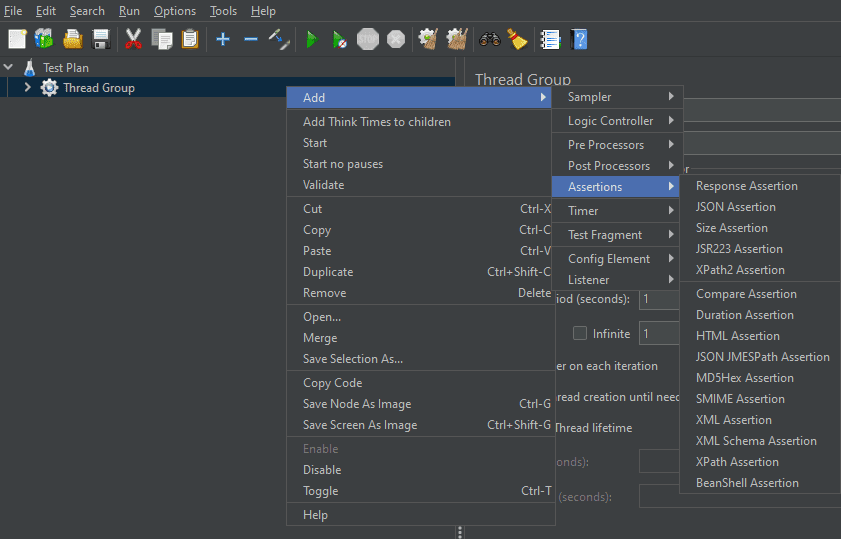
Assertions verify if server responses match expected outcomes, ensuring quality control.
- JMeter offers various assertion types:
- Response Assertion: Checks response content or status code.
- Size Assertion: Ensures response size meets expectations.
- Duration Assertion: Verified response time falls within the specified time frame.
- Additional options like XML, Beanshell, etc., meet specific needs.
Failed checks indicate where tests failed, making it easier to identify issues in the results. You can use the Listener to see detailed results of the assertions.
Configuration Elements
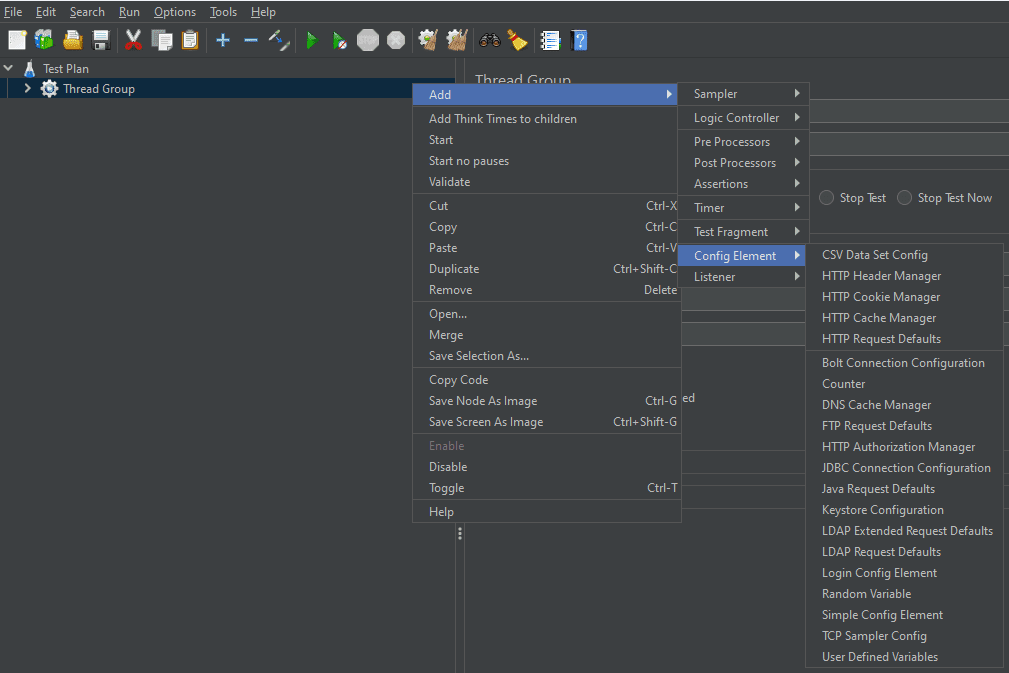
Configuration Elements are components used to set up configuration settings for the test plan. These elements provide configurations that can be applied to one or more samplers within a thread group. They help customize requests sent to servers. For example, CSV Data Set Config reads data from CSV files. While Configuration Elements don’t directly create a load, they are essential for setting up how samplers and other test plan components function. Configuration Elements are processed before Samplers in the same part of the plan.
Processors
In JMeter, processors are the elements which are used to handle requests before and after samplers. There are two types of Processors: Pre-Processors and Post-Processors.
Pre-Processors
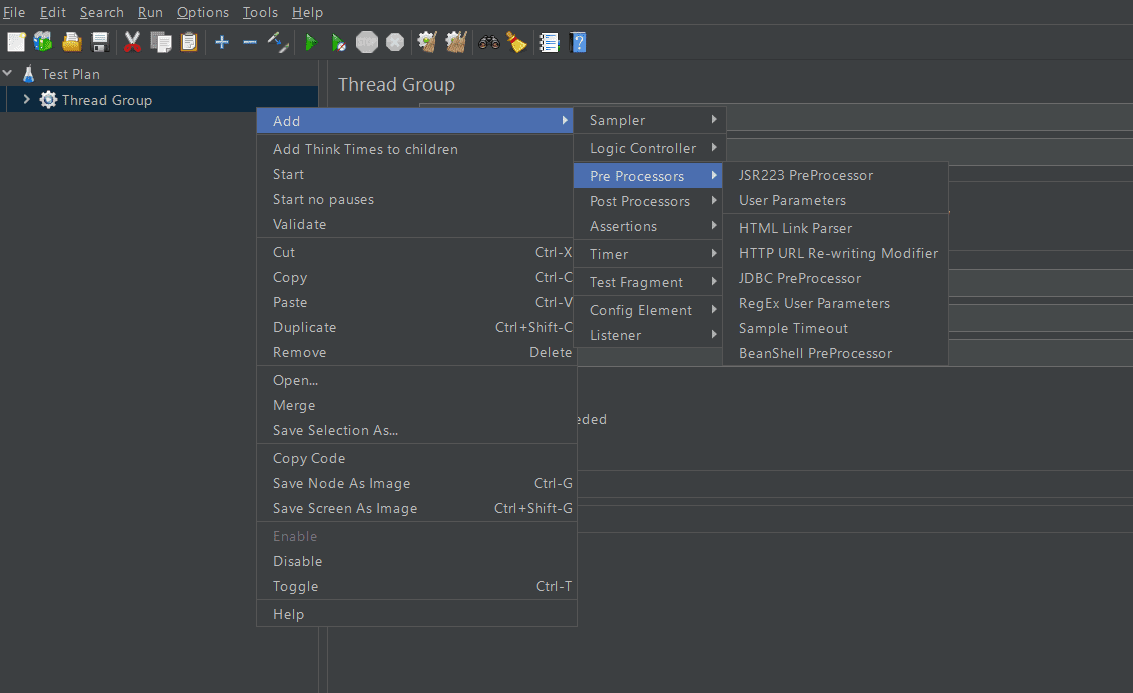
Pre-processor in JMeter runs before a sampler executes. It’s used to modify settings or update variables before a sample request runs. They can be added as children of samplers to process information before the sampler uses it.
Post- Processors
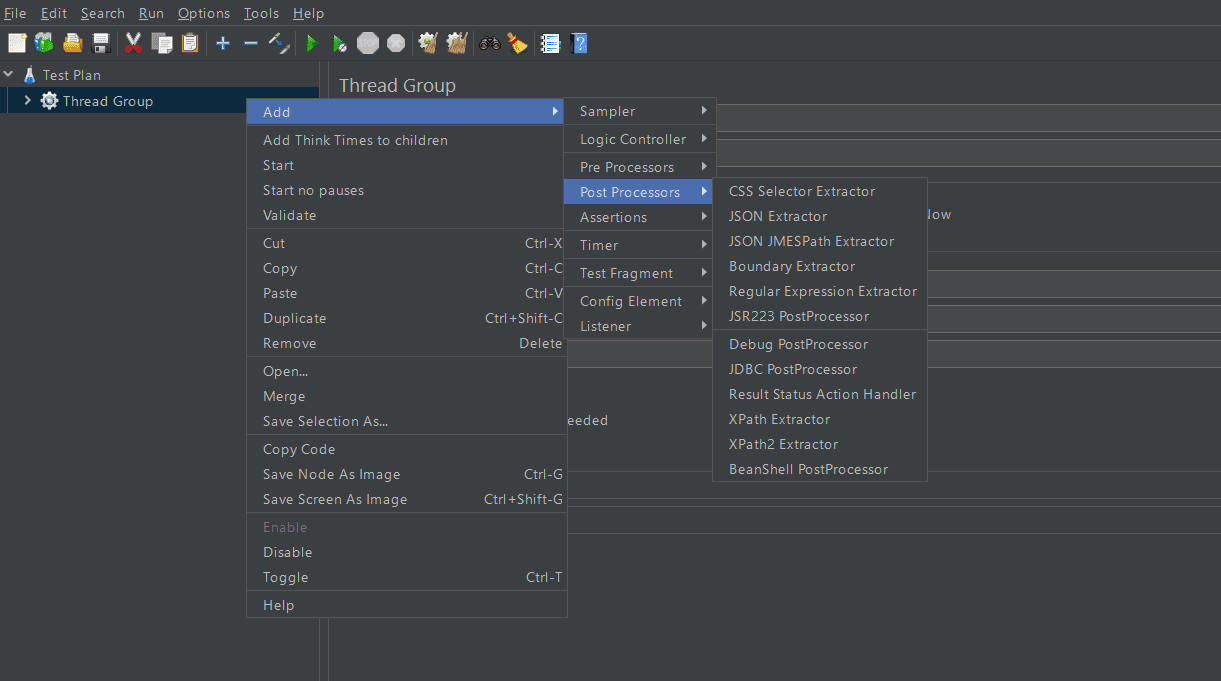
In JMeter, post-processors, which are linked as sub-elements of specific samplers, execute directly after the samplers at the same level and before assertions and listeners. Once a sampler finishes its request, post-processors jump in to analyze the response data. They can pull out valuable information or even identify any errors that might have occurred. For instance, if you want to pick out certain information from a server response and store it for future use, you can use a Regular Expression Extractor.
Test Fragment
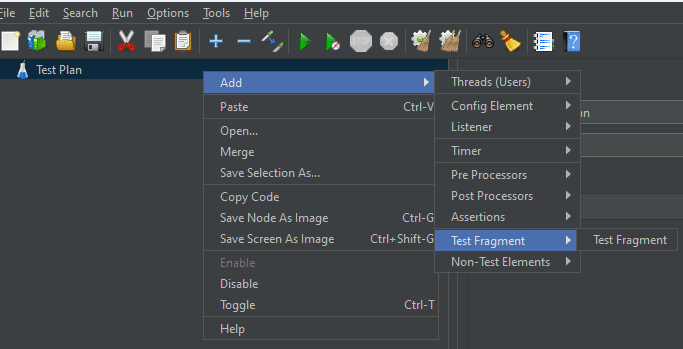
In JMeter, a Test Fragment is a reusable portion of a test plan that can be included in multiple test plans. However, its primary function is to act as a container for other elements. It remains inactive until it’s referenced by a Module/Include controller from another Thread Groups.
Getting Started with JMeter
Download & Installation
Here are the software versions used in this blog:
- Java: ‘1.8.0_391’
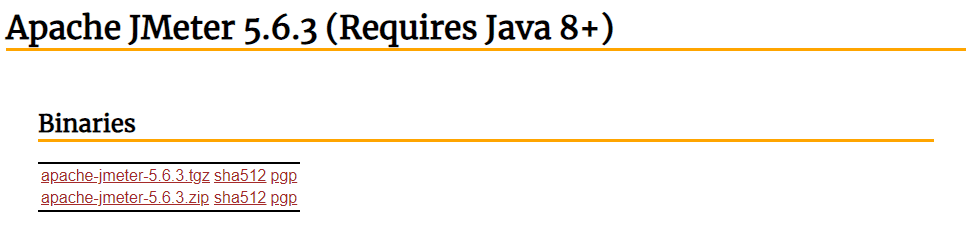
- Apache JMeter: 5.6.3
Checking for Java Installation
- Open your terminal (Command Prompt on Windows), type ‘java -version’, and press Enter.
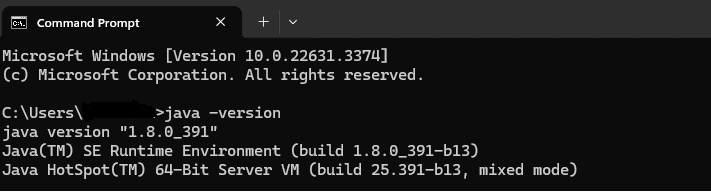
- If you see a version number, Java is installed and you’re good to go!
- If not, you’ll need to download and install Java first.
Java Download (if needed)
- Windows: Java for Windows
- Mac: Java for Mac
Download Apache JMeter
Download the appropriate JMeter file for your system from this link: Download Apache JMeter
Building the First Test Plan
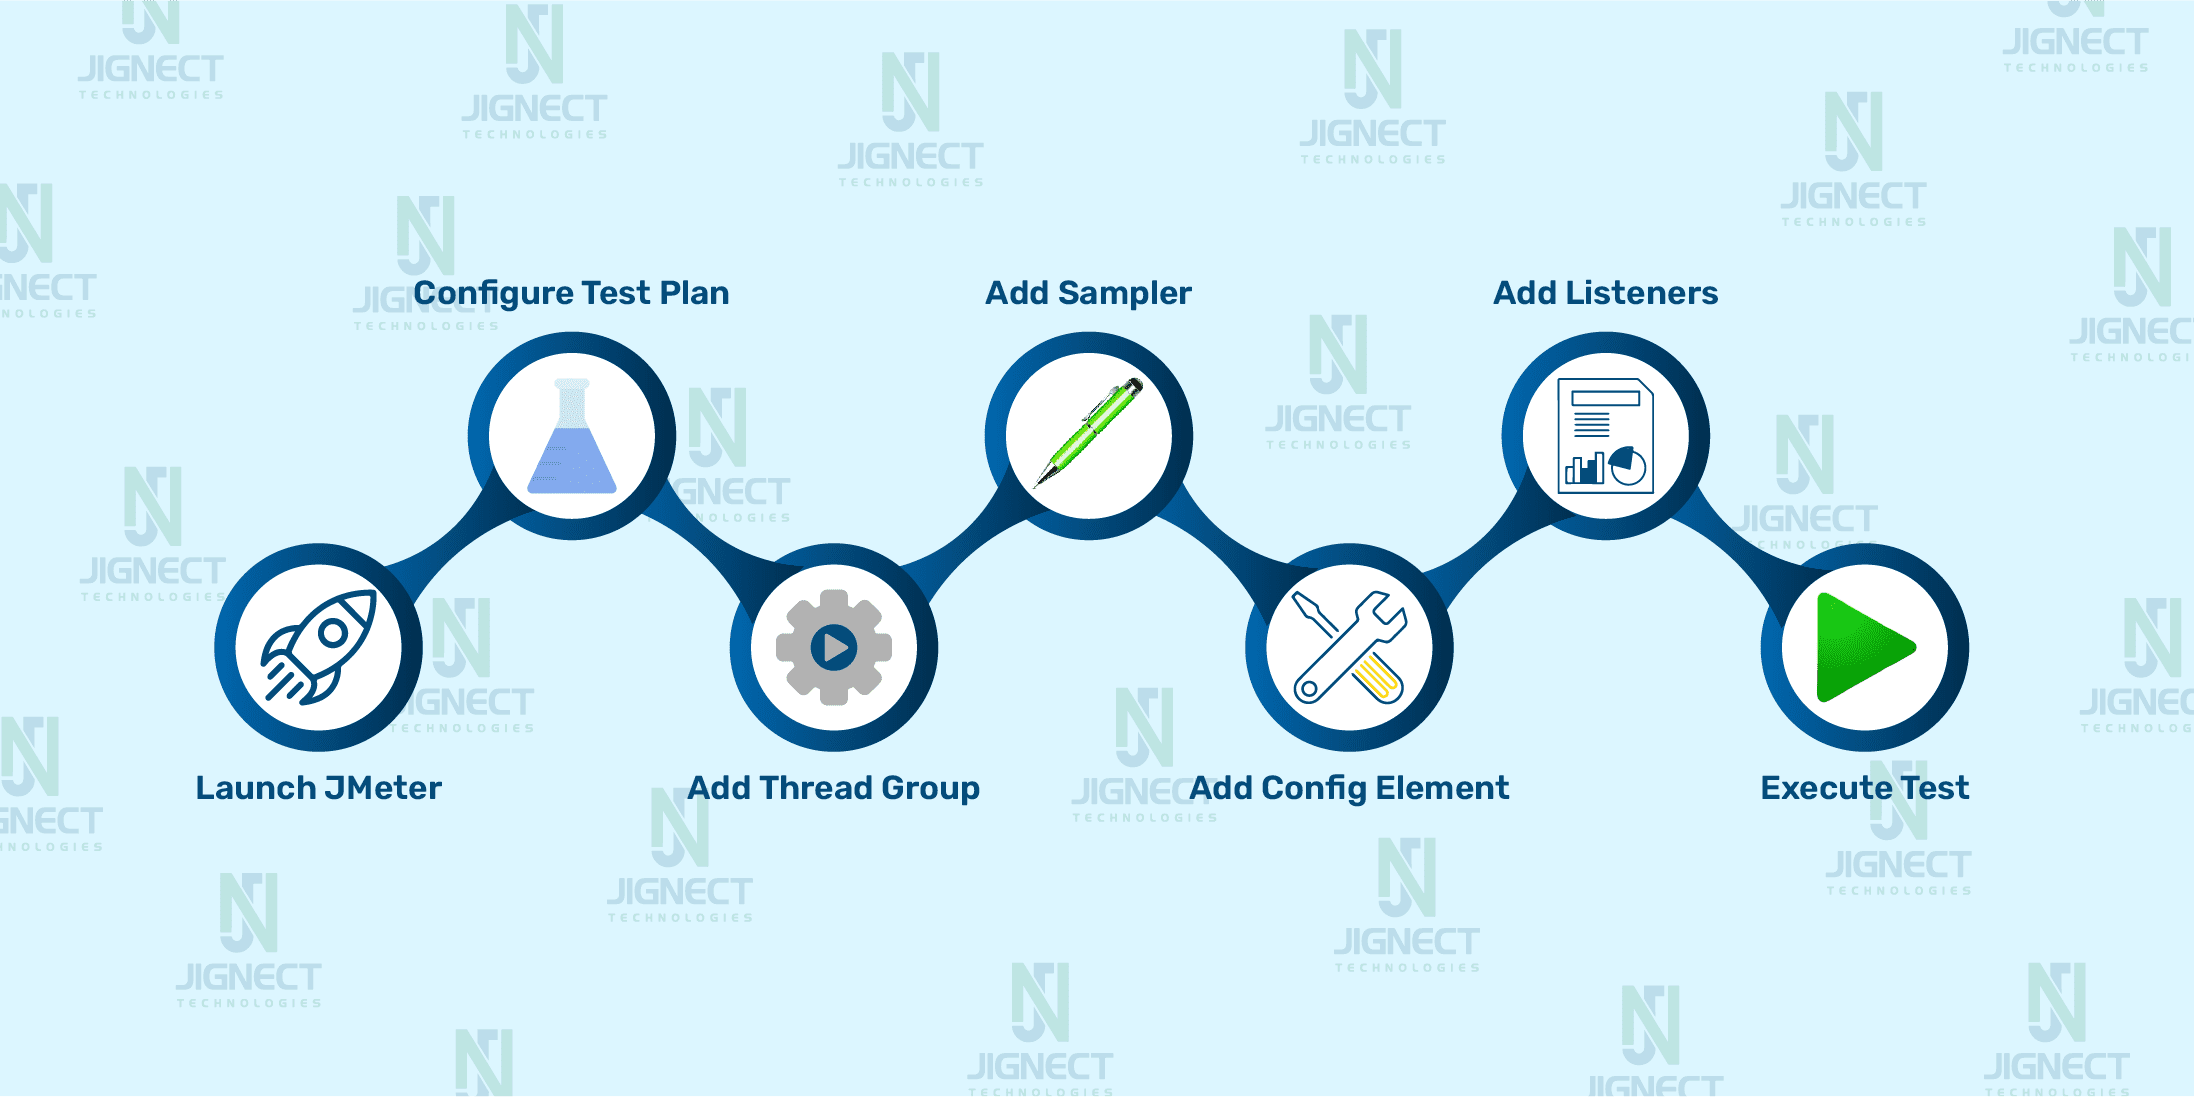
Test Scenario: Conduct performance testing for the ‘thinking-tester-contact-list.herokuapp.com’ website by logging into the application with the same user five times simultaneously.
Launch JMeter
- Extract the downloaded file to a suitable directory, then launch JMeter.
- For Windows: Navigate to the Bin folder and double-click on the jmeter.bat file.
- For Mac/Linux:
- Open the terminal and navigate to the bin directory of the extracted folder
For Ex: sh/{path_of_jmeter}/bin - Then execute the following command: sh jmeter.sh
- Open the terminal and navigate to the bin directory of the extracted folder
And there you go! JMeter should launch.
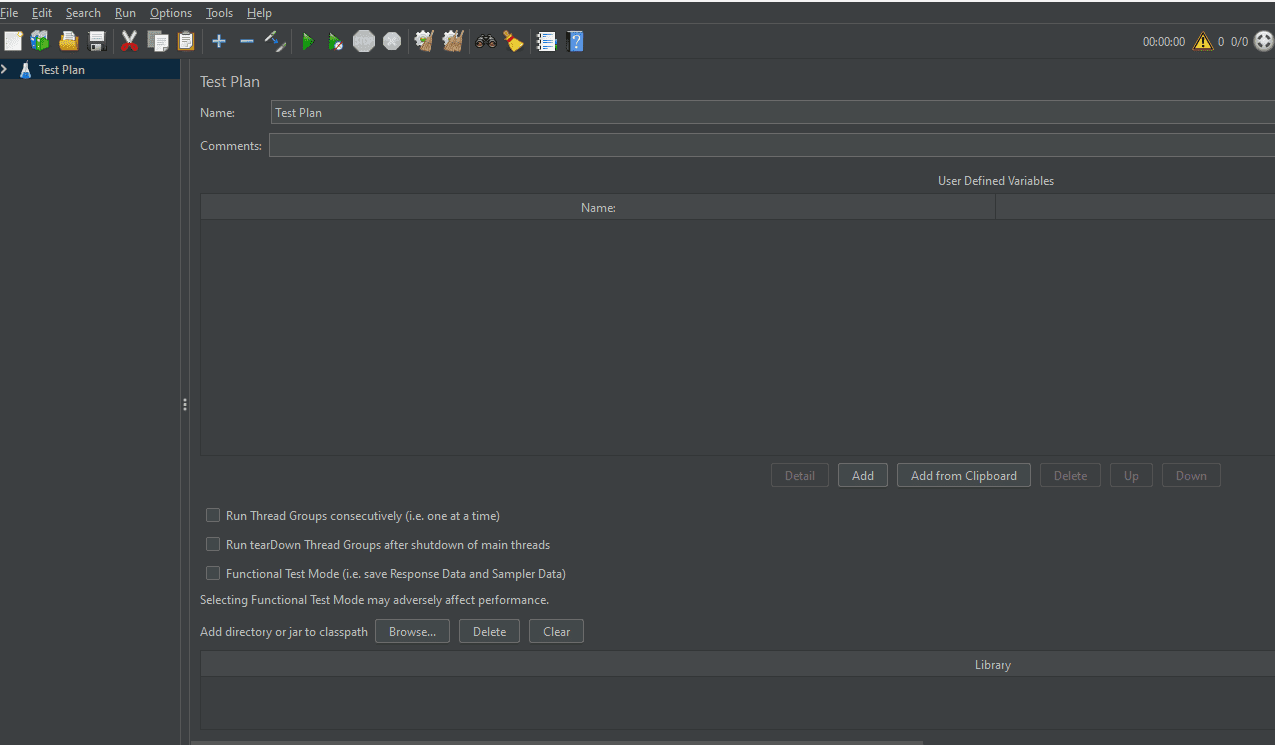
Configure the test plan
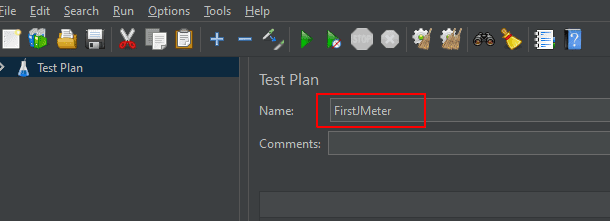
Right-click on the Test Plan element in the Test Plan tree and rename the Test Plan as ‘FirstJMeter’.
Add a Thread Group
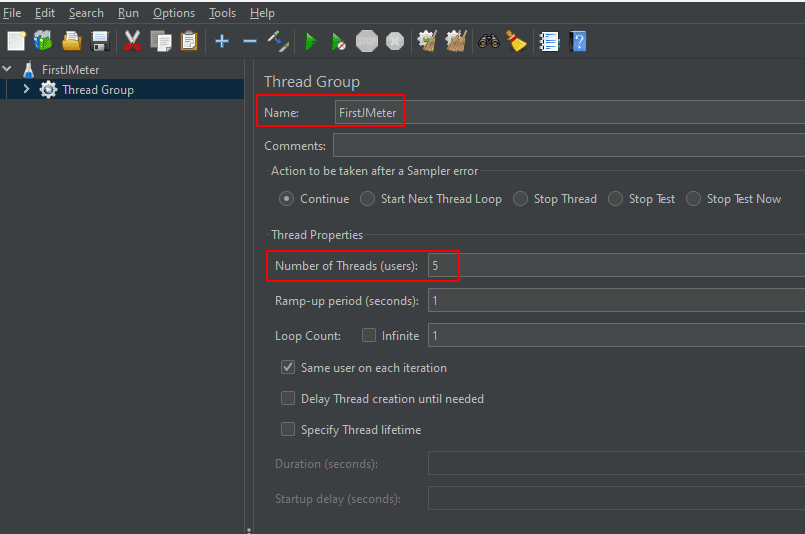
- Right-click on the renamed Test Plan i.e. ‘FirstJMeter’ > Add > Threads (Users) > Thread Group
- Rename the Thread Group as ‘Jmeter First Test’
- In this JMeter test, we’re setting the value of the ‘Number of Threads’ field to 5. This means 5 virtual users will execute the test simultaneously.
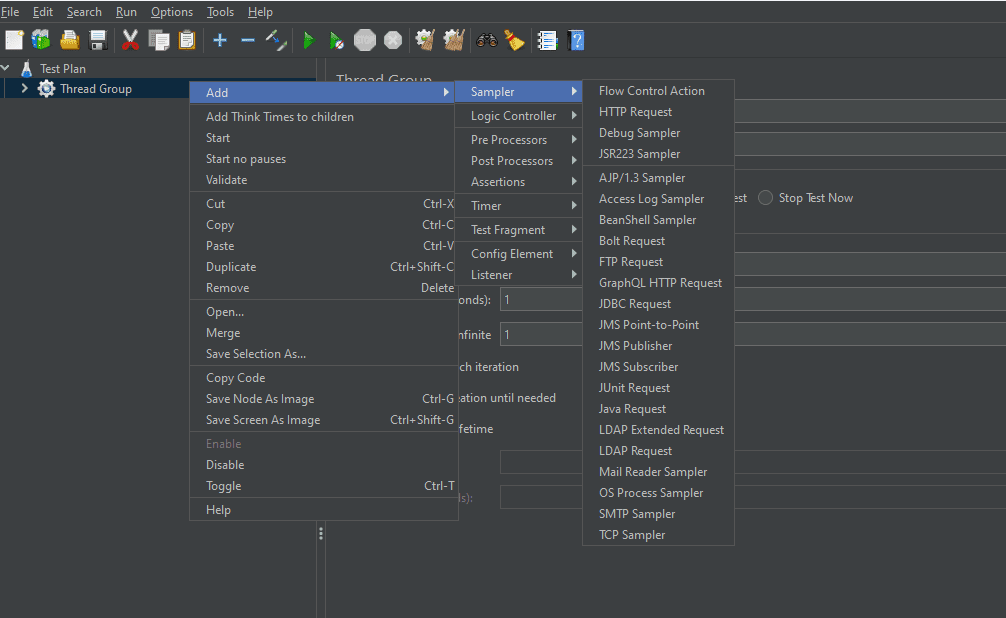
Add and Configure Sampler- HTTP Request
Right-click on ‘JMeter First Test’ (Thread Group) in the left pane > Add > Sampler > HTTP Request.
Configure HTTP Request
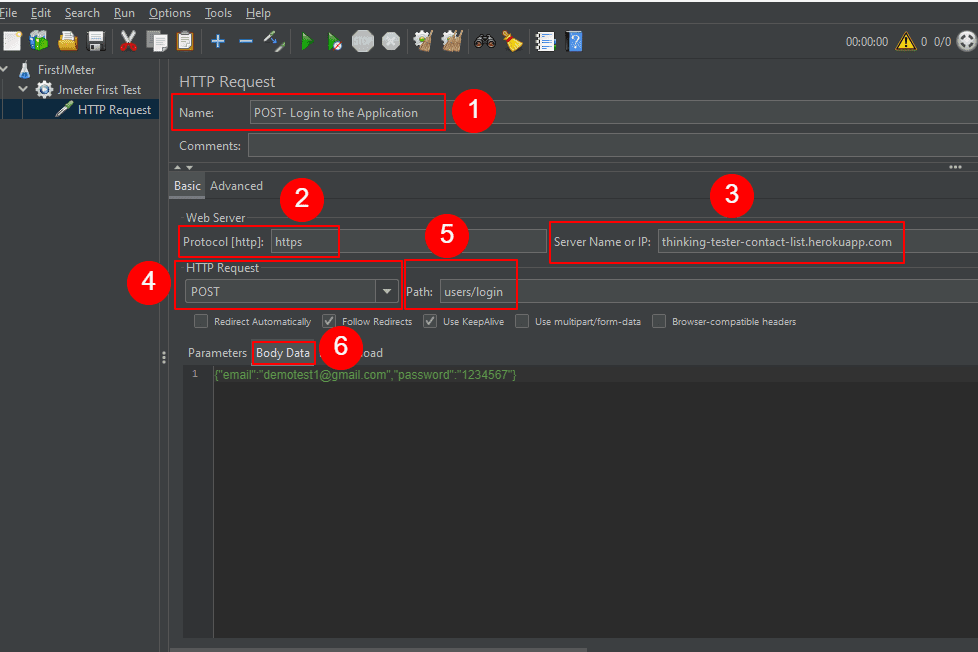
- Rename the HTTP Request Sampler Name as ‘POST- Login to the Application’
- Specify the protocol (http or https) in the ‘Protocol[http]’ field
- Enter the server address or IP (‘thinking-tester-contact-list.herokuapp.com’) in the ‘Server Name or IP’ field.
- Choose the HTTP Request Type ‘POST’.
- Enter the Path of the Api as ‘users/login’.
- Provide the necessary Body Data or Parameters. Here, we’ve provided the below body data:
- {“email”:”demotest1@gmail.com”,”password”:”1234567″}
Add Config Element- HTTP Header Manager
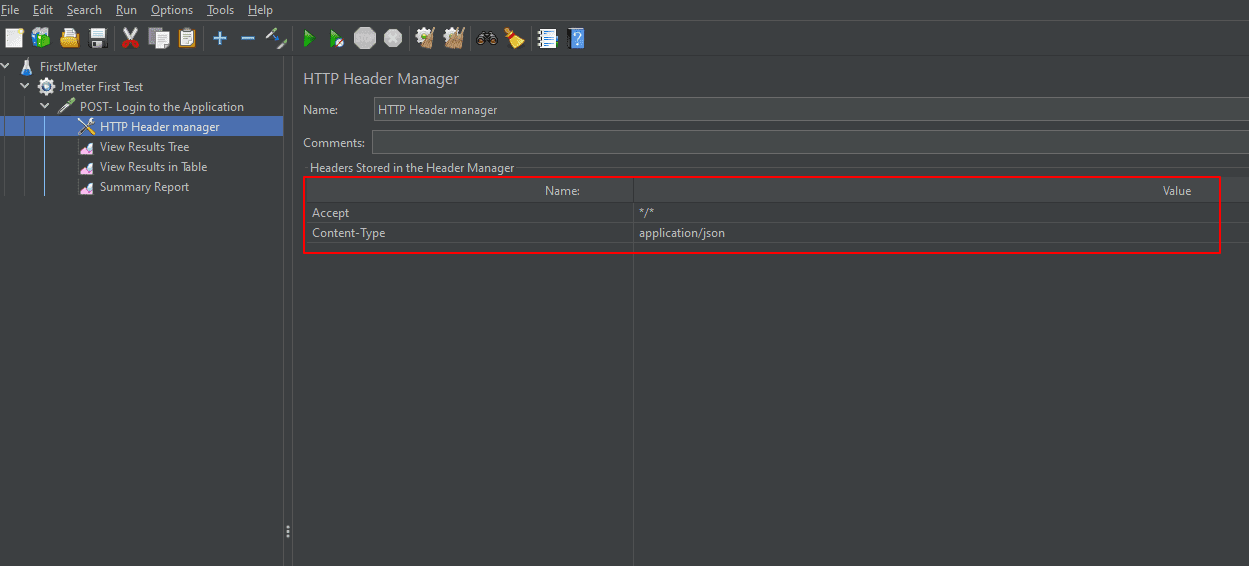
The HTTP Header manager is used to customise HTTP request headers sent by JMeter’s HTTP sampler. Right Click on ‘POST- Login to the Application’ (HTTP Sampler) > Add > Config Element > HTTP Header Manager.
Here we’ve added the two main HTTP Headers:
| Name | Value |
| Accept | */* |
| Content-Type | application/json |
Add Listeners to View the Results
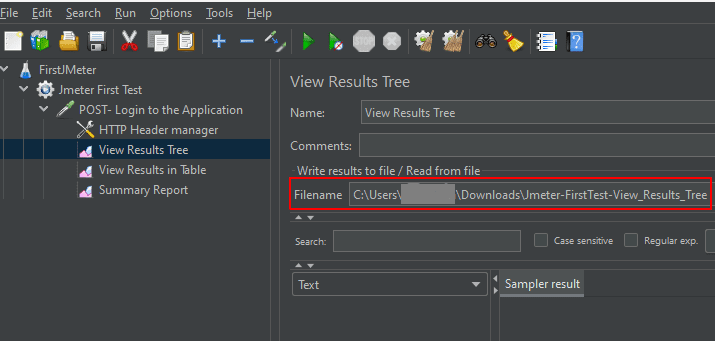
Add View Results Tree: Right-click on ‘JMeter First Test’ (Thread Group) > Add > Listener > View Results Tree. Before running the test plan, you need to specify the location along with the filename in the ‘filename’ field. After execution, the report will be downloaded to the specified location.
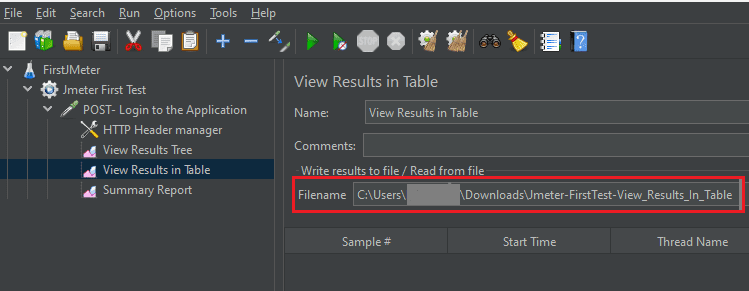
Add View Results in Table: Right-click on HTTP Request Sampler > Add > Listener > View Results in Table. Specify the location along with the filename in the ‘filename’ field.
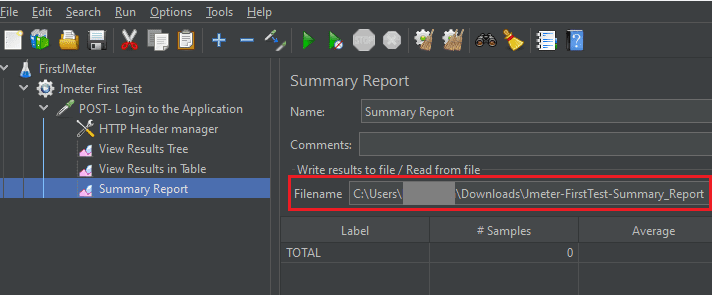
Add Summary Report: Right-click on HTTP Request Sampler > Add > Listener >Summary Report. Specify the location along with the filename in the ‘filename’ field.
Execute the Test
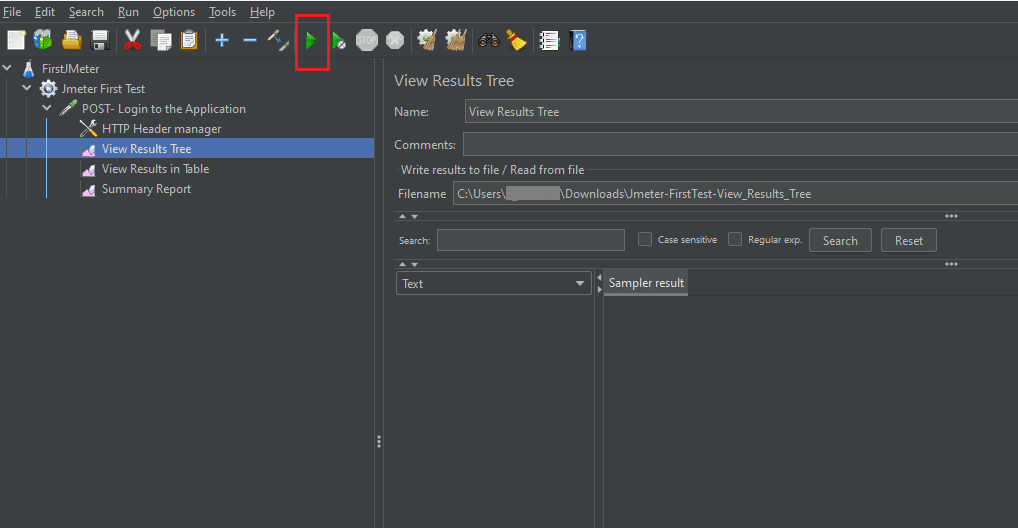
Don’t forget to save your hard work! You can find the save option under the ‘File’ menu. Just click ‘Save’ to keep your test plan for future use. Time to see your test in action! Click the green ‘Play’ button on the toolbar to initiate the test run. JMeter will mimic your users and fire off the requests you’ve defined.
View and Analyze Report
Once the test finishes, it’s time to see what happened!
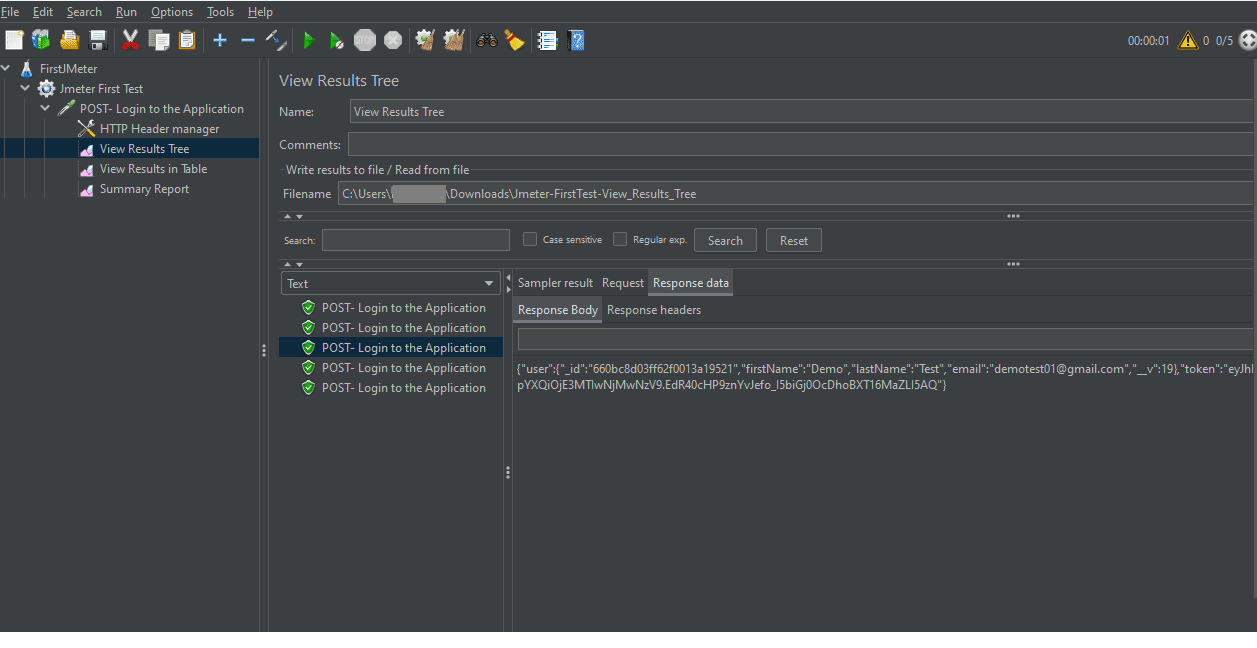
Analyze View Results in Tree: Switch to the ‘View Results Tree’ option. View Results Tree displays detailed results of performance tests in a structured format. It helps testers inspect responses, debug issues, validate correctness, analyze performance metrics, and generate reports efficiently. By clicking on each sampler users can view different tabs to analyze information from various perspectives. These tabs typically include:
- Sampler Result: Provides an overview of the sample’s success or failure, response time, bytes transferred, and other relevant metrics.
- Request: Displays details about the request made, such as URL, HTTP method, headers, etc.
- Response Data: This shows the body of the response received from the server, allowing users to inspect the actual content returned.
Keep an eye out for the green checkmark. If it appears green, that’s a good sign! It means your test with 5 simulated users ran successfully.
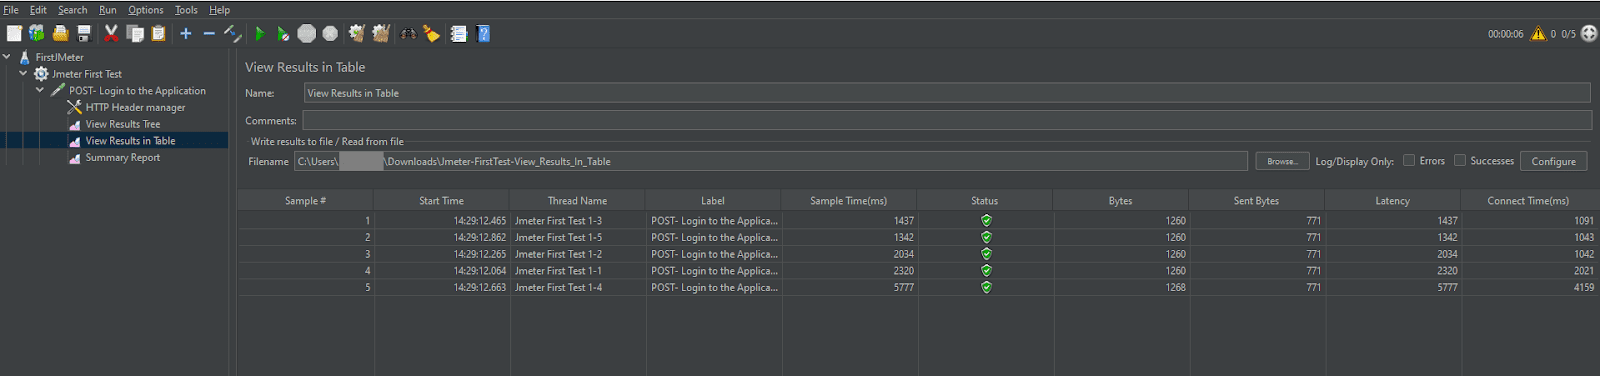
Analyze View Results in Table: Switch to the ‘View Results in Table’ option. This listener shows details for each test sampler in a table format.The results appear in the order the samplers were tested.
Below information is displayed in View Results in table Listener.
- Sample: Identifier or index of the sample.
- Thread Name: Name of the thread executing the sample.
- Label: Descriptive label or identifier of the sample.
- Sample Name: Name of the sample.
- Status: Indicates whether the sample was successful or not.
- Bytes: Size of the response data in bytes.
- Sent Bytes: Size of the request data sent, if applicable.
- Latency: Time taken for the request to be sent and the first response to be received.
- Connect Time (ms): Time taken to establish a connection with the server, measured in milliseconds.
Look for a green checkmark or ‘success’ status, indicating that the test ran without errors.
Analyze Summary Report: The Summary Report listener in JMeter gives you a fast and easy way to see how your test performed. It’s like a quick report card that shows you the important information like:
- Request Name: Identifies the tested request.
- Samples: Number of times each request was executed.
- Average: Typical response time for each request.
- Min/Max: Fastest and slowest recorded response times.
- Std Dev: This represents the standard deviation of the response times, indicating how much the response times varied from the average.
- Errors: Percentage of requests that failed.
- Throughput: Rate of requests completed per second.
- Received KB/Sec: This shows the average rate of data received from the server per second, measured in Kilobytes.
- Sent KB/Sec: This shows the average rate of data sent to the server per second, measured in Kilobytes.
- Avg Bytes: This shows the average size (in bytes) of the response data received for each request.
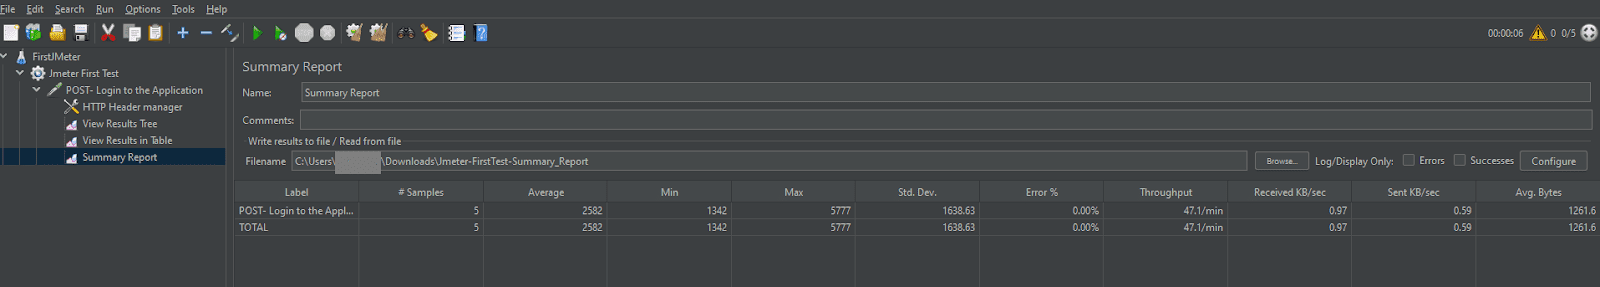
You can click the ‘Configure’ button to add more info fields to the listeners. This helps you get a detailed test report. To export this data of the listeners, specify the file path including the filename in the ‘Filename’ field. After executing the Test Plan, the report will download automatically to the specified location in CSV format.
Conclusion
Apache JMeter is a free, open-source performance testing tool that works across various software types, making it a flexible option for many applications. Its use of Java lets it work on lots of different operating systems, and it’s easy for everyone to use. Beginners can try it out with its simple testing features, while experts can do more complex testing with its scripting tools. JMeter excels at simulating high user loads, perfect for stress testing software during peak or high usage periods of the system. It has a supportive community, offers extensive plugin functionalities to enhance its capabilities, and integrates seamlessly with development workflows for continuous testing. Additionally, JMeter provides detailed reports for result analysis, assisting in problem identification and resolution. Apache JMeter is effective for software performance testing but has drawbacks. Learning its complex features is challenging for beginners, and running extensive tests can slow down computers. Also, reports might require customization for in-depth analysis.
In conclusion, Apache JMeter is a versatile and free tool for testing software performance, particularly websites and web services. It enables users to identify weaknesses and simulate real-world scenarios, offering features like performance testing, functionality checks, multi-user simulation, and comprehensive analysis. With its intuitive interface, cross-platform compatibility, multi-threading capabilities, and extensive protocol support, JMeter remains a top choice for organizations seeking reliable and efficient performance testing solutions.
Keep practicing and exploring to master these powerful tools further with Jignect.
Witness how our meticulous approach and cutting-edge solutions elevated quality and performance to new heights. Begin your journey into the world of software testing excellence. To know more refer to Tools & Technologies & QA Services.
If you would like to learn more about the awesome services we provide, be sure to reach out.
Happy Testing 🙂

")
