

Introduction to K6
K6 is a free and open-source performance testing tool for assessing the load and reliability of web applications and APIs. Developed in Go and utilizing a JavaScript scripting environment, K6 allows developers and testers to effortlessly create and execute performance tests. K6 is known for its ease of use, extensibility, and full-featured capabilities. K6 is optimized for minimal resource consumption, making it well-suited for conducting high-loads such as spike, stress and soak tests. Its capacity to simulate realistic user behavior and support automated testing workflows makes k6 an idea choice for continuous performance testing in CI/CD pipelines.
Key Features of K6
- Scripting language: K6 uses JavaScript as its scripting language.
- Multiple protocol support: K6 supports various protocols including HTTP, gRPC, WebSockets and more.
- CLI and APIs: K6 provides a command line interface that allows to execute load test and monitoring results.
- Integration with CI/CD pipelines: K6 integrates with Jenkins, GitLab CI and GitHub Actions, letting you seamlessly automate performance testing within the CI/CD pipeline. This ensures early detection of issues and continuous performance monitoring.
- Scalability and distribution: K6 allows you to scale tests by running them on multiple machines, simulating higher user loads. Additionally, you can distribute tests across different geographic locations.
- Document and community: K6 has detailed docs and active community empower learning, with contributions and best practices shared to keep you on top of performance testing.
- Performance metrics and visualization: K6 offers a comprehensive range of performance metrics, which includes: Throughput, Error rates, Response times, and Latency. These metrics are gathered during test execution and can be exported in multiple formats for in-depth analysis. Additionally, K6 seamlessly integrates with leading monitoring tools like Grafana, facilitating real-time visualization and examination of performance data.
K6 Installation
K6 performance testing script can be written in any text editor or IDE that supports JavaScript, as K6 scripts are written in JS. Below are several widely used IDEs suitable for writing k6 script.
- Visual Studio Code
- IntelliJ IDEA
- Sublime Text
- Atom
In this blog, we have utilized the following versions for the respective libraries and applications.
- K6: v0.50.0
- Visual Studio Code: 1.89.0
- Chocolatey: 2.2.2
The steps to follow to install K6 on Windows and Mac are as follow :-
1. For Windows
For Windows, we can install K6 by these 2 package Managers.
- Chocolatey package manager
- Windows Package Manager
a. Windows Package Manager
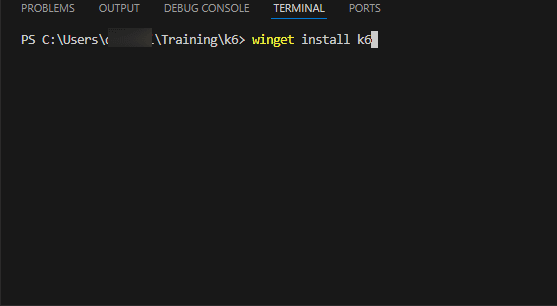
- Launch the Visual Studio code and Open the command prompt.
- Run the following command to install k6 using Windows: ‘winget install k6’.
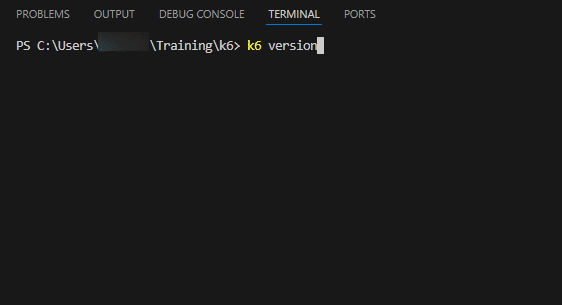
- Once the installation is completed, you can check the version by running ‘k6 version’ command and then can start using k6 for performance testing.
b. Chocolatey Package Manager
- What is Chocolatey package manager?
- Chocolatey is an open-source and command line package manager specifically designed for Windows that simplifies the process of downloading and installing software.
- Steps to install K6
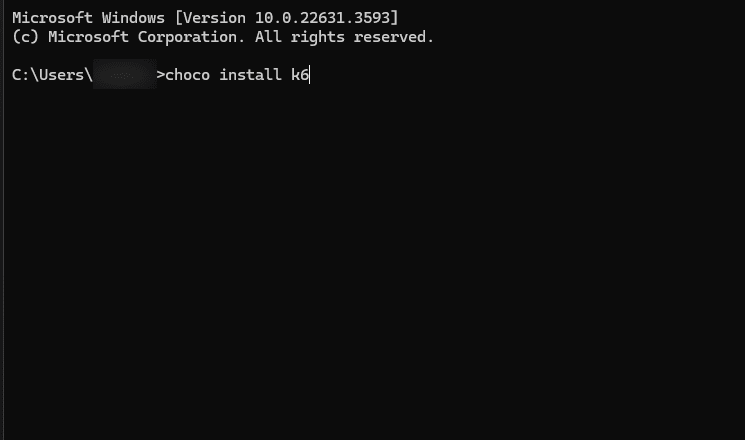
- Open the command prompt with administrator privileges or when using Chocolatey in an environment, you need to choose an alternative location for installation, rather than sticking to the default installation directory.
- Run the following command to install k6 using Chocolatery: ‘choco install k6’.
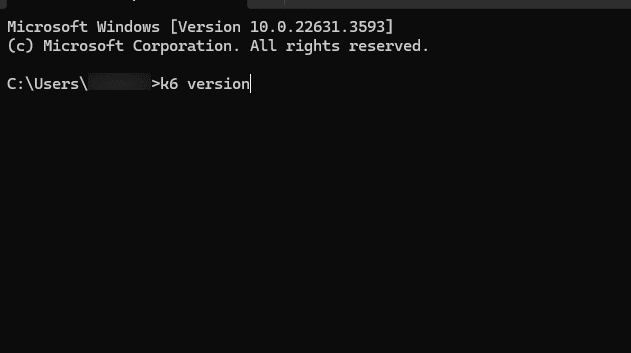
- Once the installation is completed, you can check the version by running the ‘k6 version’ command and then can start using k6 for performance testing.
2. For Mac
- Use the package manager as Homebrew for installing k6 on macOS.
- Open the terminal on your macOS machine.
- Run the following command to install k6 using Homebrew: ‘brew install k6’.
- Once the installation is completed, you can check the version by running the ‘k6 version’ command and then can start using k6 for performance testing.
Write your First Test Script with K6
Note: Here I’m using the Window Package Manager.
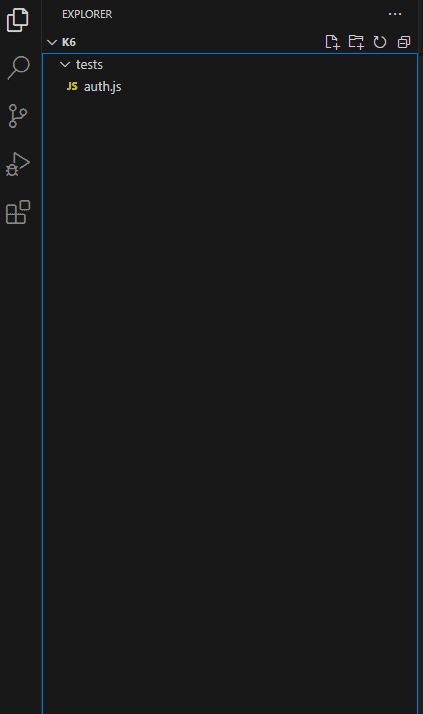
- Open the Visual Studio Code and open the folder where you want to store the scripts.
- Create a folder to store a test script and then create a file with the ‘.js’ extension.
- Below is the script for the GET request.
import http from "k6/http";
import { check } from "k6";

const Base_url = "https://demo.guru99.com";

export let options = {
  duration: "1m",
  vus: 5,
};

export default function () {
  const getResponse = http.get(`${Base_url}/test/newtours/index.php`);

  if (getResponse.status == 200) {
    check(getResponse, {
      "response time is less than 500ms": (res) => res.timings.duration < 500,
    });
    const cookies = getResponse.cookies;
    const modifiedCookies = JSON.parse(cookies);
    const phpsessid = modifiedCookies.PHPSESSID.value;
    return phpsessid;
  } else {
    console.error("Case failed:", getResponse.status);
    return;
  }
}
Explanation
- First, import the http module from k6 for making HTTP requests.
- Base_url is a constant variable storing the base URL for the website being tested.
- options is an object that defines two key settings for the k6 test.
- – duration: This property sets the total duration of the test.
- – vus: This property sets the number of virtual users participating.
- http.get performs a GET request to the target URL. The URL is constructed by concatenating the Base_url with the specific path.
- An if statement checks the response status code. If the response is successful, the script uses the check() functionality to verify that the response time is less than 500 milliseconds. Then the script retrieves the cookies associated with the response using the ‘response.cookies’. The retrieved cookies are then parsed as a JSON object using ‘JSON.parse’. The script specifically extracts the value of the cookie named ‘PHPSESSID’ from the JSON object.
- If the response code is not successful then indicating an error and the script logs an error message using ‘console.error’.
Run the Tests and Analyze Result
1. Run the Test
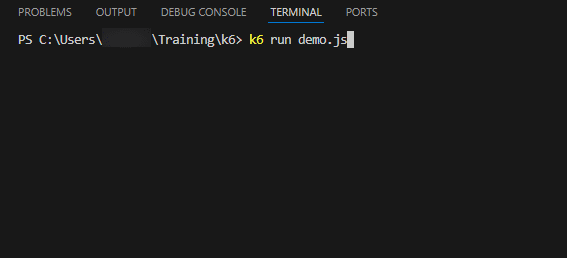
- Open the integrated terminal and navigate to the folder containing the test script and then hit the below command :-
K6 run file_name.js
2. Analyze Result
- After completing the tests, you’ll find the test results displayed in the terminal, showing the metrics such as response time, error rate and request count.
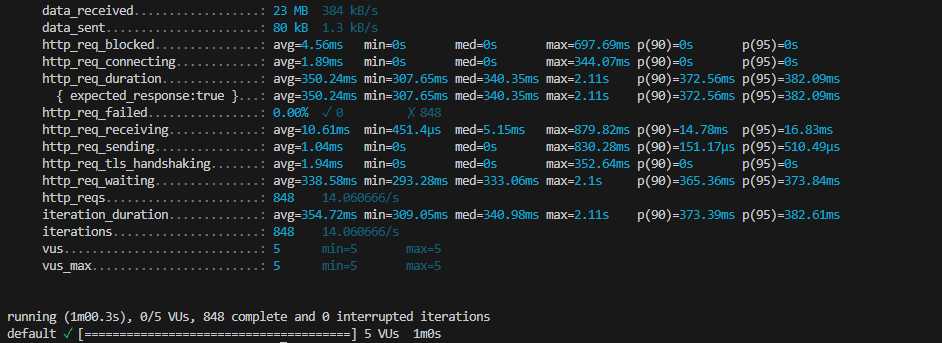
- data_received: This indicates the total amount of data received from the server during the test.
- data_sent: This shows the total amount of data sent to the server during the test.
- http_req_blocked: This metric measures the average time a virtual user spent waiting for a free slot to initiate a new HTTP request.
- http_req_connecting: This shows the average time spent establishing a connection with the server for each HTTP request.
- http_req_duration: This is the total time it takes to complete an HTTP request, including all phases like connecting, sending data, and receiving data. This is a crucial metric for overall performance evaluation.
- http_req_failed: This reports the percentage and count of failed HTTP requests.
- http_req_receiving: This shows the average time spent receiving data from the server after the request was sent.
- http_req_sending: This reports the average time spent sending data to the server.
- http_req_tls_handshaking: This measures the average time spent establishing a secure TLS connection for each request.
- http_req_waiting: This shows the average time a VU spent waiting for various stages of request to complete, excluding the time spent blocked for a free slot.
- http_reqs: This reports the total number of HTTP requests made during the test.
- iteration_duration: This shows the average time it took for a single iteration to complete.
- iterations: Similar to http_reqs, this reports the total number of iterations completed during the test.
- vus: This indicates the number of virtual users simulated during the test.
- vus_max: Similar to vus, this shows the maximum number of concurrent VUs used during the test.
Conclusion
Whenever discussing load testing, JMeter often comes to mind first due to its beginner-friendly GUI. However, JMeter, being Java-based, can consume significant RAM during execution. In contrast, K6 is built using the Go language, enabling faster performance and lower RAM usage. Additionally, k6 utilizes JavaScript for scripting, offering flexibility and ease of use.
K6 is a robust open-source tool for conducting performance testing on web applications, APIs, and microservices, offering advantages such as easy JavaScript-based test scripting, advanced features like thresholds and detailed reporting, seamless integration with CI/CD pipelines, and flexible execution models. However it may have limitations in a potential learning curve for those new to performance testing, the debugger can be tricky and also requires adequate system resources to simulate user interactions.
K6 remains a popular choice among developers and testers due to its open-source nature, active community support, and ability to simulate real-world load conditions effectively. With proper setup and understanding, k6 enables teams to ensure their applications perform well under various load conditions, contributing to a better user experience and overall application reliability.
Keep practicing and exploring to master these powerful tools further with Jignect.
Witness how our meticulous approach and cutting-edge solutions elevated quality and performance to new heights. Begin your journey into the world of software testing excellence. To know more refer to Tools & Technologies & QA Services.
If you would like to learn more about the awesome services we provide, be sure to reach out.
Happy Testing 🙂


