
What is Selenium?
Selenium stands as the industry-standard open-source tool for automating web browsers. It’s not just a testing framework; it’s a powerful suite that empowers developers and quality assurance professionals to write scripts that interact with web applications as a real user would. Imagine having a diligent, tireless robot meticulously checking every corner of your website.
With Selenium, you can programmatically instruct a browser to:
- Open a website: Navigate to any URL with precision.
- Click buttons: Simulate user clicks on interactive elements.
- Fill forms: Input data into text fields, dropdowns, and checkboxes.
- Check whether certain elements or messages are visible: Assert the presence or absence of text, images, or interactive components.
- And much more! From dragging and dropping to handling pop-ups, Selenium covers a vast array of browser interactions.
This capability allows testers to simulate complex user flows and verify if a website is working exactly as expected, uncovering defects long before they reach end-users.
Think of Selenium like a robot that does all your manual website testing for you, automatically.
What are Azure Pipelines?
Azure Pipelines is Microsoft’s robust CI/CD (Continuous Integration/Continuous Delivery) tool, seamlessly integrated within the comprehensive Azure DevOps platform. CI/CD represents a set of practices designed to deliver software more frequently and reliably by automating the build, test, and deployment phases.
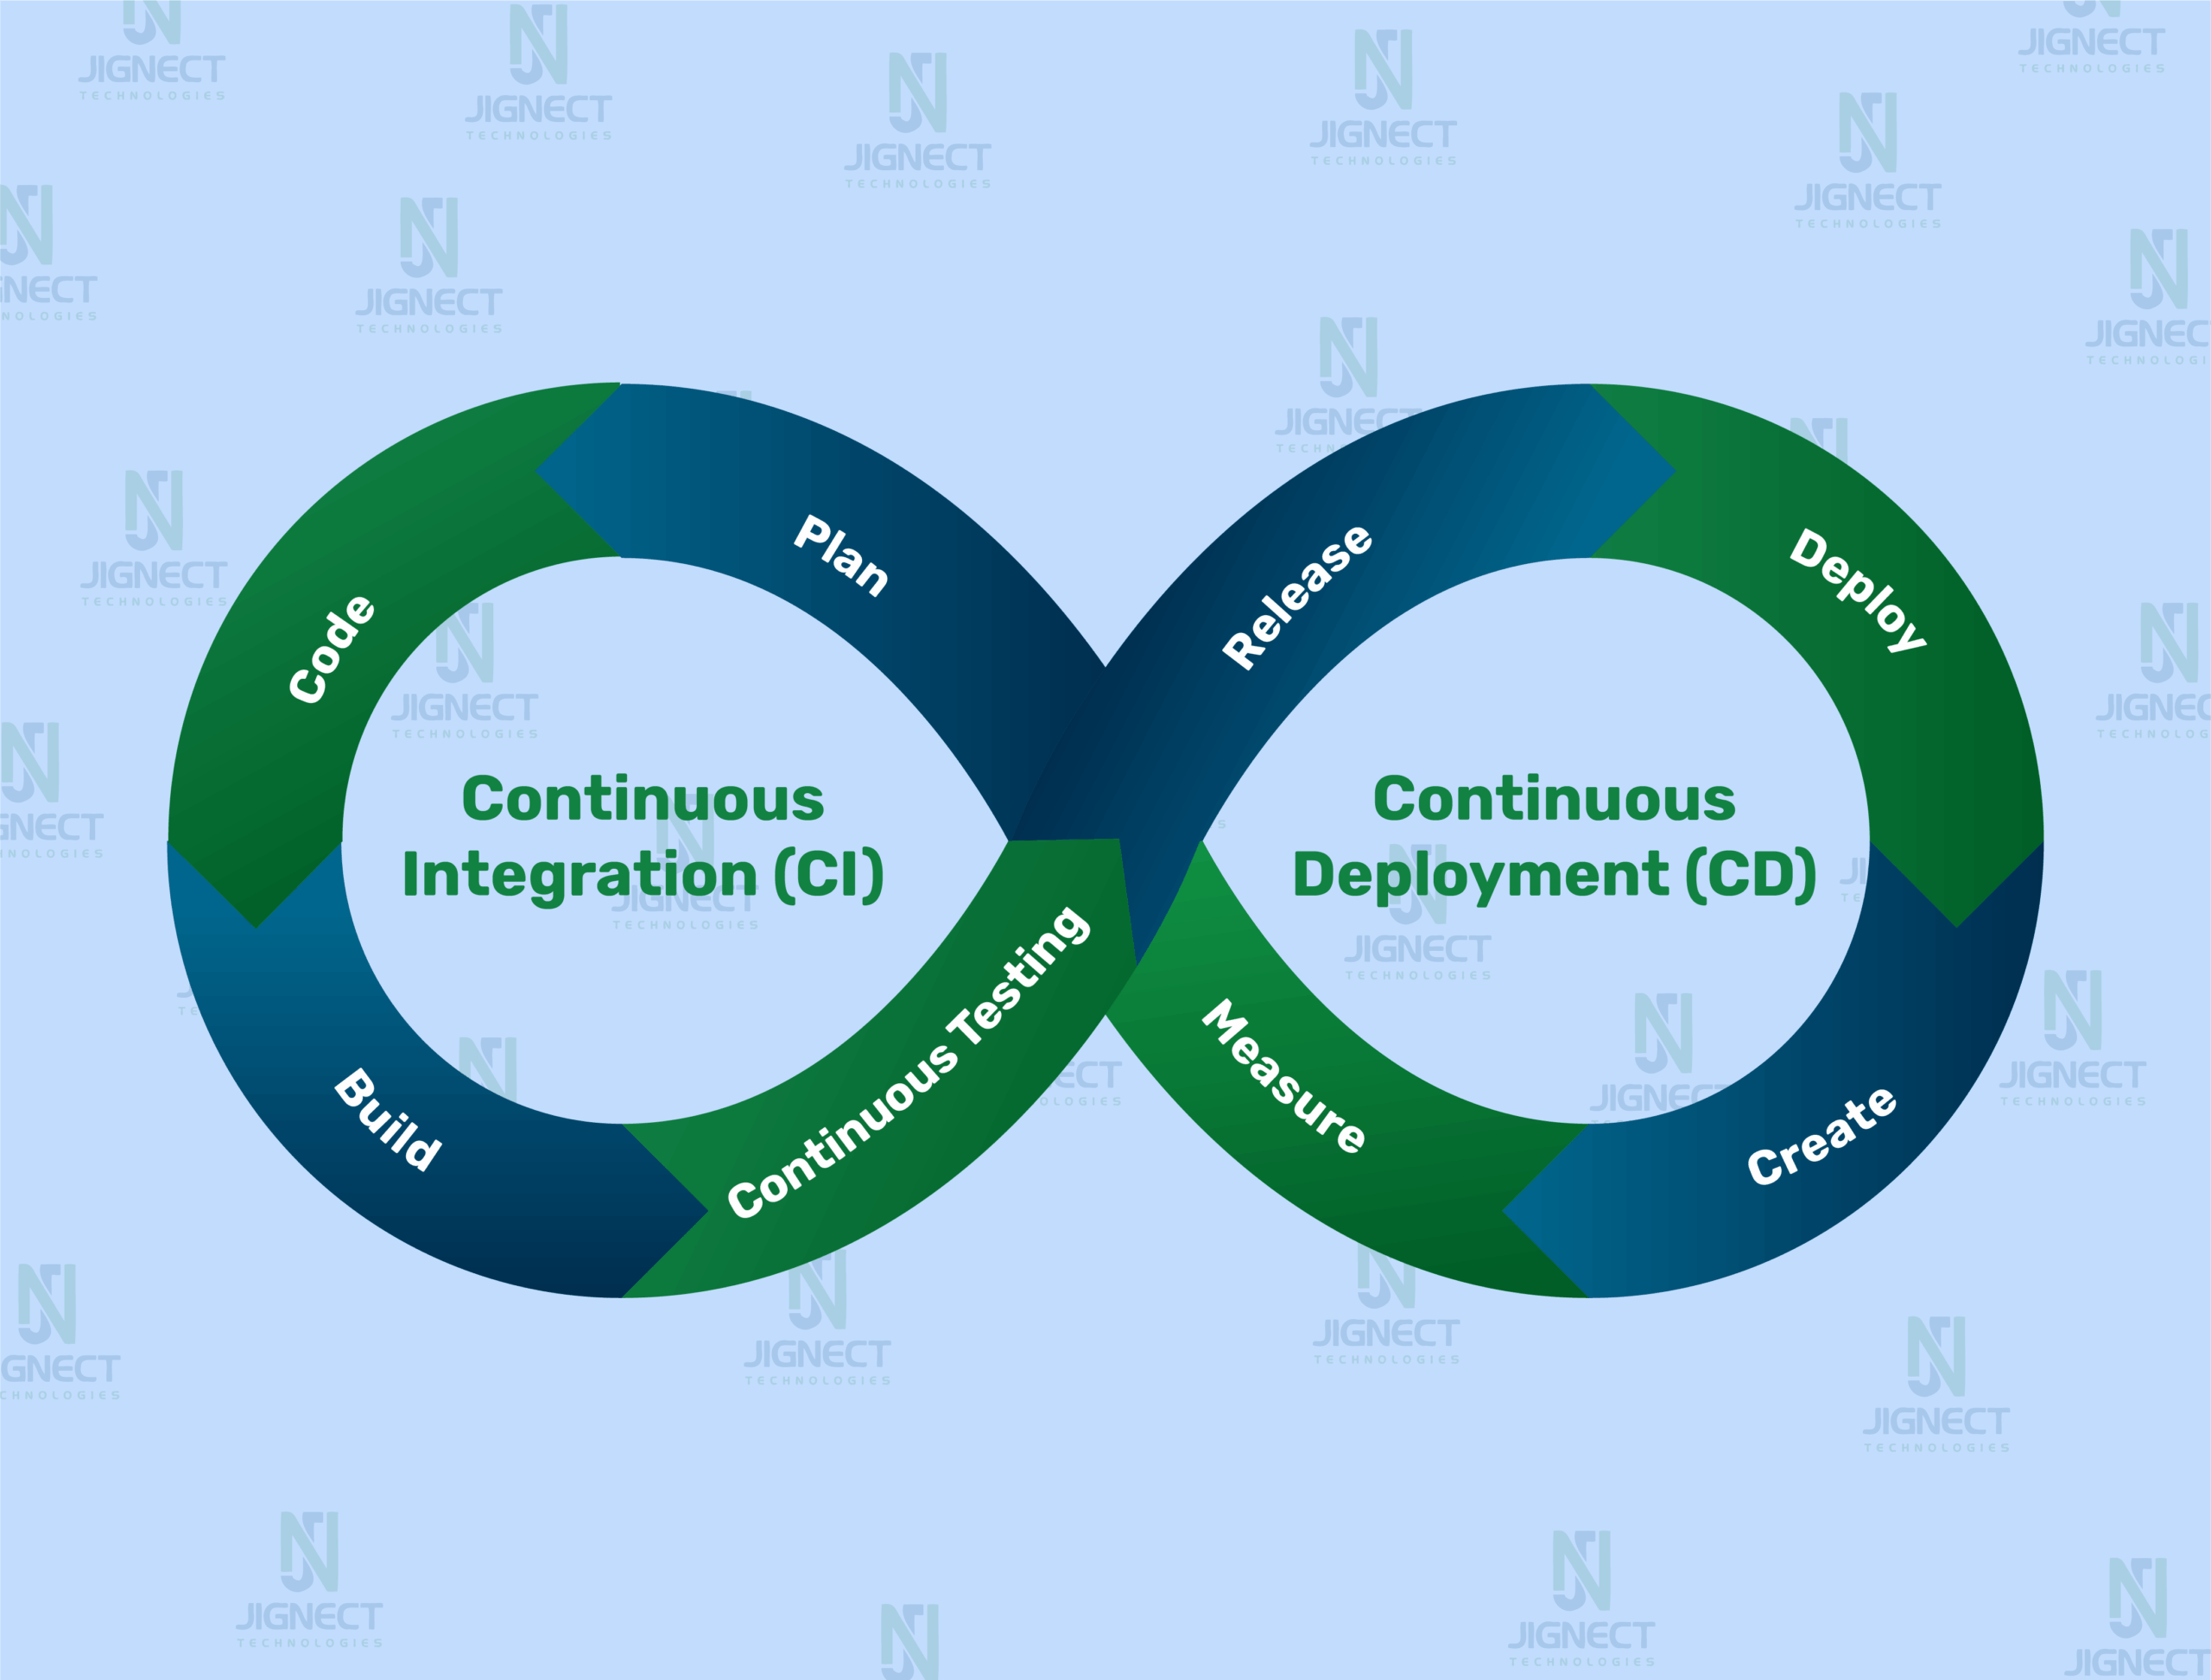
- Continuous Integration (CI): This pillar is about automatically building and testing your code every single time a developer commits a change to the shared repository. It’s the practice of integrating code changes frequently to detect and address integration issues early.
- Continuous Deployment (CD): This takes CI a step further by automatically delivering the latest, validated version of your application to various environments (like QA, Staging, or even Production) after successful testing.
Azure Pipelines helps you:
- Build your application: Automatically compile your source code (e.g., your C# code) into deployable artifacts.
- Run your automated tests: Execute your entire suite of automated tests, including critical Selenium UI tests, ensuring quality at every commit.
- Deploy your app to environments: Orchestrate the automatic deployment of your validated application to different stages of your software delivery pipeline.
You can imagine Azure Pipelines as your test factory it checks everything step-by-step before shipping the final product.
Why Integrate Them?
By strategically integrating Selenium tests into Azure Pipelines, you’re not just connecting two tools; you’re forging a powerful synergy that combines the precision of web test automation with the unparalleled efficiency of continuous integration. This integration transforms your development lifecycle, offering profound advantages:
- Tests run automatically after every code change or deployment: Gone are the days of manual test execution. Every time a developer pushes code, your automated tests spring into action, providing immediate feedback.
- Developers get instant feedback if something is broken: Instead of discovering issues days or weeks later, developers are alerted to regressions within minutes, allowing for rapid remediation and preventing bugs from festering.
- Saves a lot of manual effort and time: Automating repetitive UI checks frees up valuable human resources, allowing your QA team to focus on more complex, exploratory testing that requires human intuition.
- Ensures fewer bugs reach production: By catching defects early and continuously, the risk of critical bugs slipping into live environments is drastically reduced, leading to more stable and reliable releases.
- Helps build a more reliable software delivery process: This integrated approach creates a robust safety net, fostering confidence in your releases and enabling faster, more predictable delivery cycles.
Imagine the peace of mind: you push a code update, grab a coffee, and return to find out if everything passed or failed – all without clicking a single manual button! This is the promise of integrating Selenium with Azure Pipelines.
- What is Selenium?
- What are Azure Pipelines?
- Prerequisites
- Creating a Selenium Test Project in C#
- Pushing Your Code to Azure Repos
- Setting Up an Azure Pipeline (YAML)
- Running Tests in Azure Pipelines
- How to Trigger the Pipeline
- Using Headless Browsers for CI/CD
- Tips for Better CI/CD Integration
- Conclusion
- Bonus: Troubleshooting Common Issues
Prerequisites
Before you can orchestrate the seamless integration of Selenium tests with Azure Pipelines using C#, it’s crucial to ensure your environment is properly prepared. Think of this phase as gathering all your essential tools and familiarizing yourself with the blueprints before embarking on a significant construction project. A solid foundation here will save you considerable time and frustration down the line.
Tools and Accounts Needed
To begin this integration journey, make sure you have access to, and familiarity with, the following fundamental tools and accounts:
Visual Studio
- This is your primary Integrated Development Environment (IDE), the canvas where you will meticulously craft, debug, and run your C# Selenium test code. It provides a rich set of features that streamline development.
- Download from: https://visualstudio.microsoft.com/
.NET SDK
- The .NET SDK is absolutely essential. It’s the software development kit required to build, compile, and execute your C# code. Ensure it’s not only installed but also correctly added to your system’s PATH environment variables for command-line accessibility.
- Download from: https://dotnet.microsoft.com/en-us/download
Selenium WebDriver
- This isn’t a single download but rather a collection of libraries. It’s the powerful engine that enables your C# test scripts to programmatically control and interact with various web browsers like Chrome, Edge, Firefox, and more. You’ll incorporate these libraries into your project via NuGet packages.
- Installation: You’ll install crucial NuGet packages such as Selenium.WebDriver, Selenium.Support, and WebDriverManager directly within Visual Studio. WebDriverManager (as its name suggests) is an optional but highly recommended tool that automates the management and download of the correct browser drivers, saving you manual effort and potential compatibility headaches.
Azure DevOps Account
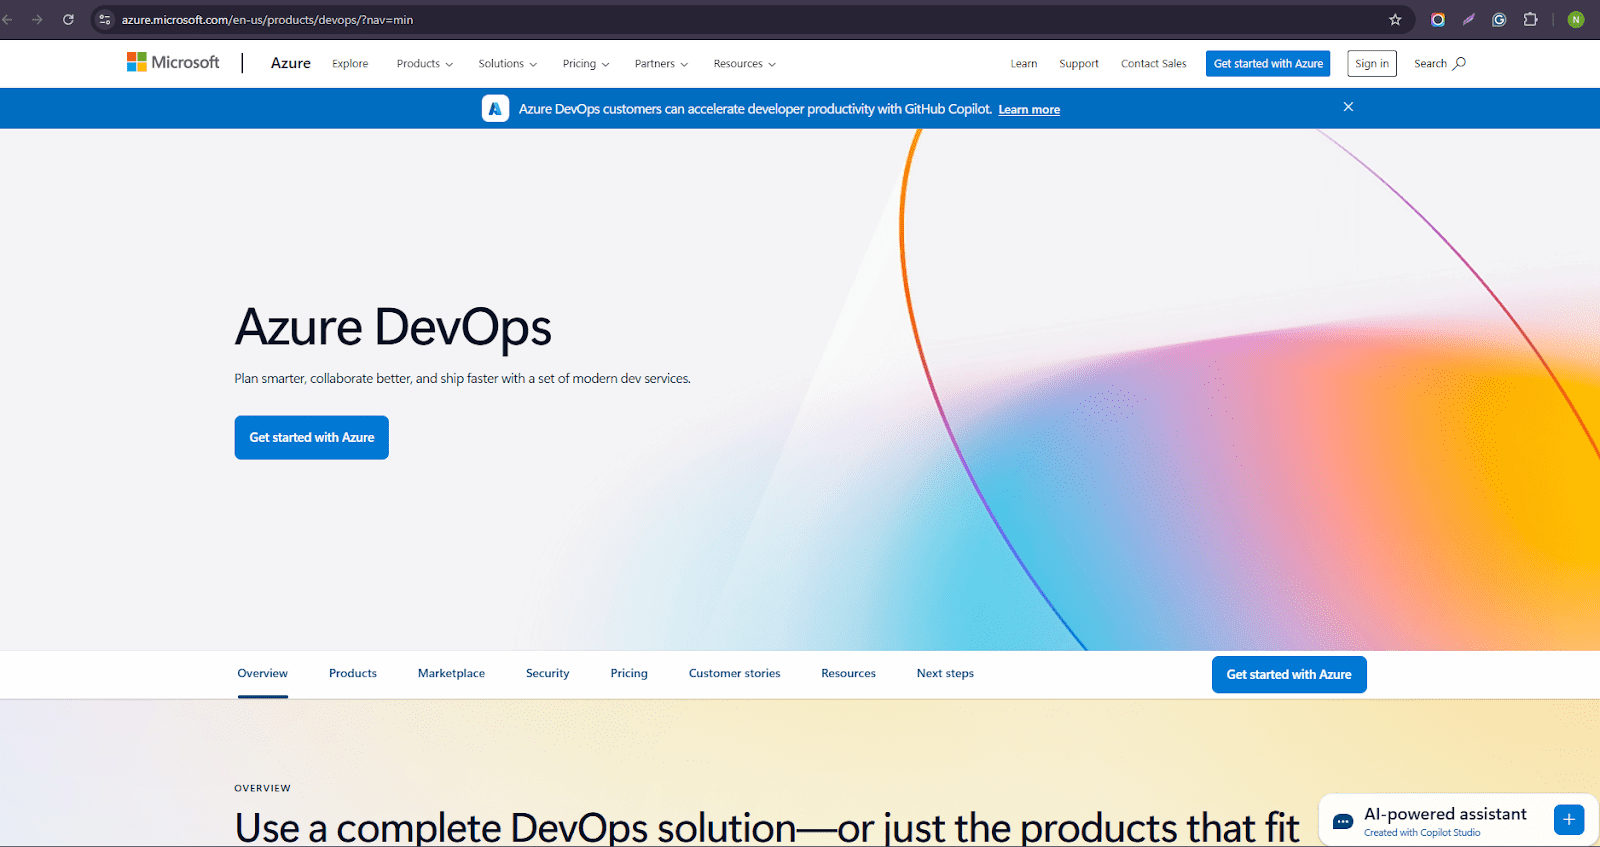
- To leverage the robust capabilities of Azure Pipelines, you will need an active account on Azure DevOps. This cloud-based platform provides a suite of tools for collaborative software development, including version control, project management, and, of course, CI/CD pipelines.
- Sign up here if you don’t already have one: https://azure.microsoft.com/en-us/services/devops/
Azure DevOps Project
- Within your Azure DevOps account, you’ll need a dedicated project. This serves as the central hub where all components of your software development lifecycle – your code repositories, pipelines, work items (boards), and more – will reside and be managed collectively.
- Create a project in Azure DevOps where you can manage repos, pipelines, boards, etc.
Git
- Git is the distributed version control system that you will use to manage your Selenium test code. It’s fundamental for tracking changes, collaborating with teams, and pushing your code to Azure DevOps Repos – the source from which your pipelines will pull code.
- Install from: https://git-scm.com/
Summary
So in short, to proceed:
- Install all the necessary tools (Visual Studio, Selenium, .NET SDK, Git).
- Create an Azure DevOps account and project.
- Understand what test automation and CI/CD mean.
Once you’ve got this setup ready, you’re all set to start the integration process!
Creating a Selenium Test Project in C#
Having prepared your development environment, the next logical step in our automation journey is creating the Selenium test project in C# using Visual Studio. This project forms the bedrock of your automated testing efforts, eventually serving as the source for execution within Azure Pipelines.
While this blog focuses on the Azure Pipelines integration, setting up a robust Selenium test project involves a few key steps:
- Project Setup: Typically, you’d begin by creating an NUnit or MSTest Test Project in Visual Studio.
- Package Installation: Essential NuGet packages such as Selenium.WebDriver, Selenium.Support, and the highly recommended WebDriverManager are installed to enable browser interaction.
- Basic Test Case: A sample test is then crafted, utilizing [SetUp], [Test], and [TearDown] attributes to manage browser lifecycle and define test actions (e.g., navigating, interacting with elements, asserting outcomes).
For a complete, hands-on tutorial that meticulously guides you through each of these project creation and initial test writing steps, please visit our dedicated article:
Streamline Your Testing: Move from Manual to Automation with Selenium and C#
With your Selenium test project now in place and your tests ready, we can move forward with integrating your code into Azure Repos for pipeline automation.
Pushing Your Code to Azure Repos
Once you’ve meticulously crafted and verified your Selenium tests in C# locally, the critical next step is to centralize your code in Azure Repos. This isn’t just about storage; it’s about establishing version control, enabling seamless collaboration with teammates, and, most importantly, providing the essential source for your Azure Pipelines to pick up and automate your CI/CD workflow. Let’s walk through the process of pushing your project to this cloud-based Git repository.
Let’s walk through how to push your project to Azure Repos.
What is Azure Repos?
Azure Repos is a cornerstone service within Microsoft Azure DevOps, offering a comprehensive, cloud-hosted Git repository system. It functions similarly to popular platforms like GitHub or Bitbucket, but with the distinct advantage of being deeply integrated into the broader Azure ecosystem, providing a unified experience for code management, CI/CD, and project tracking. It ensures your source code, including your valuable automated tests, is secure, versioned, and accessible to your entire team and automated processes.
Step 1: Create a Git Repository in Azure DevOps
Before you can push your code, you need a destination in the cloud.
Navigate to Azure DevOps: Open your web browser and go to https://dev.azure.com. Log in with your Azure DevOps credentials.
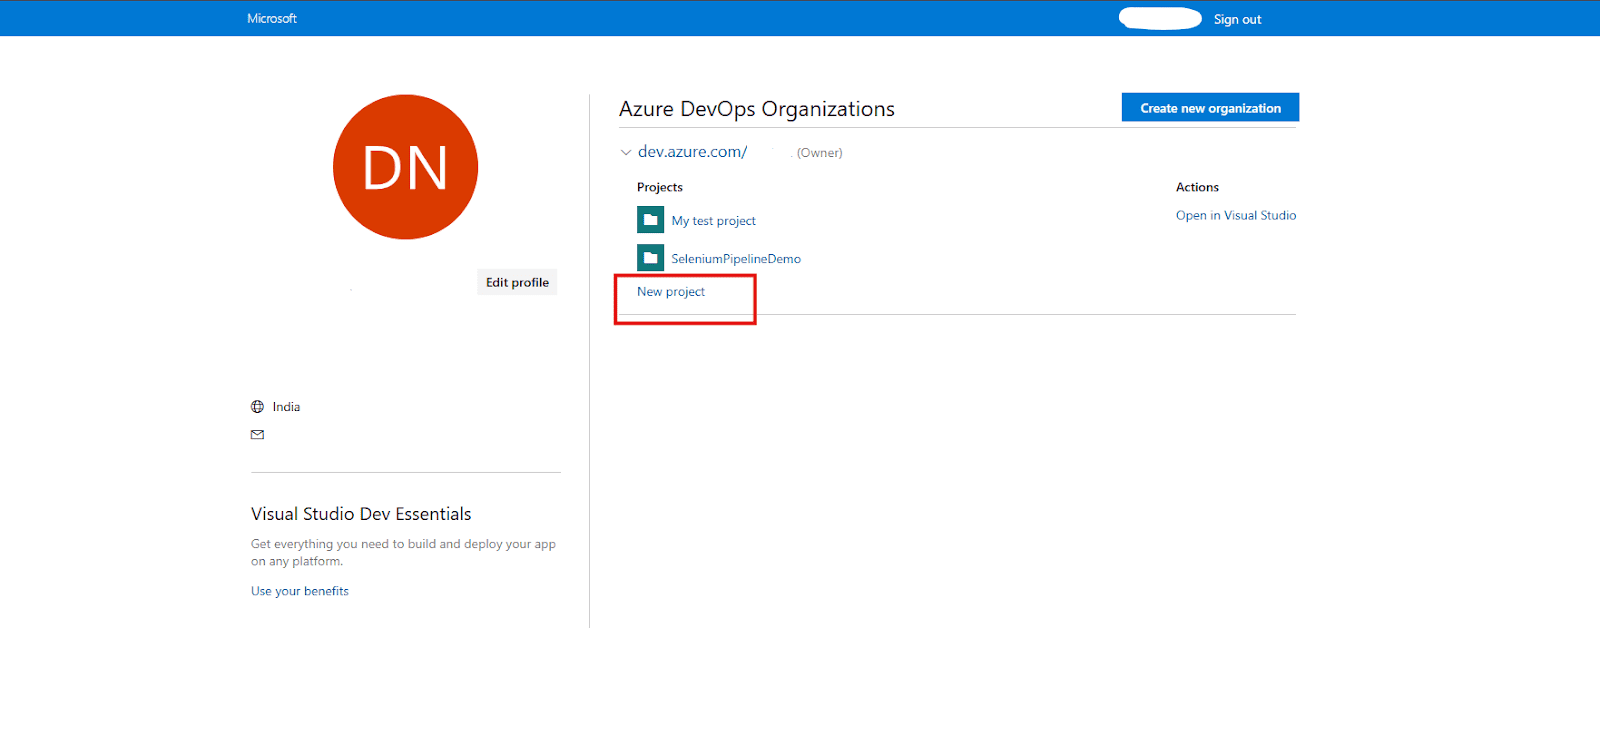
Select or Create Project: Choose the existing Azure DevOps project where you intend to house your Selenium test project, or create a new one if you haven’t already.
Access Repositories: In the left-hand navigation sidebar, click on Repos, then select Files.
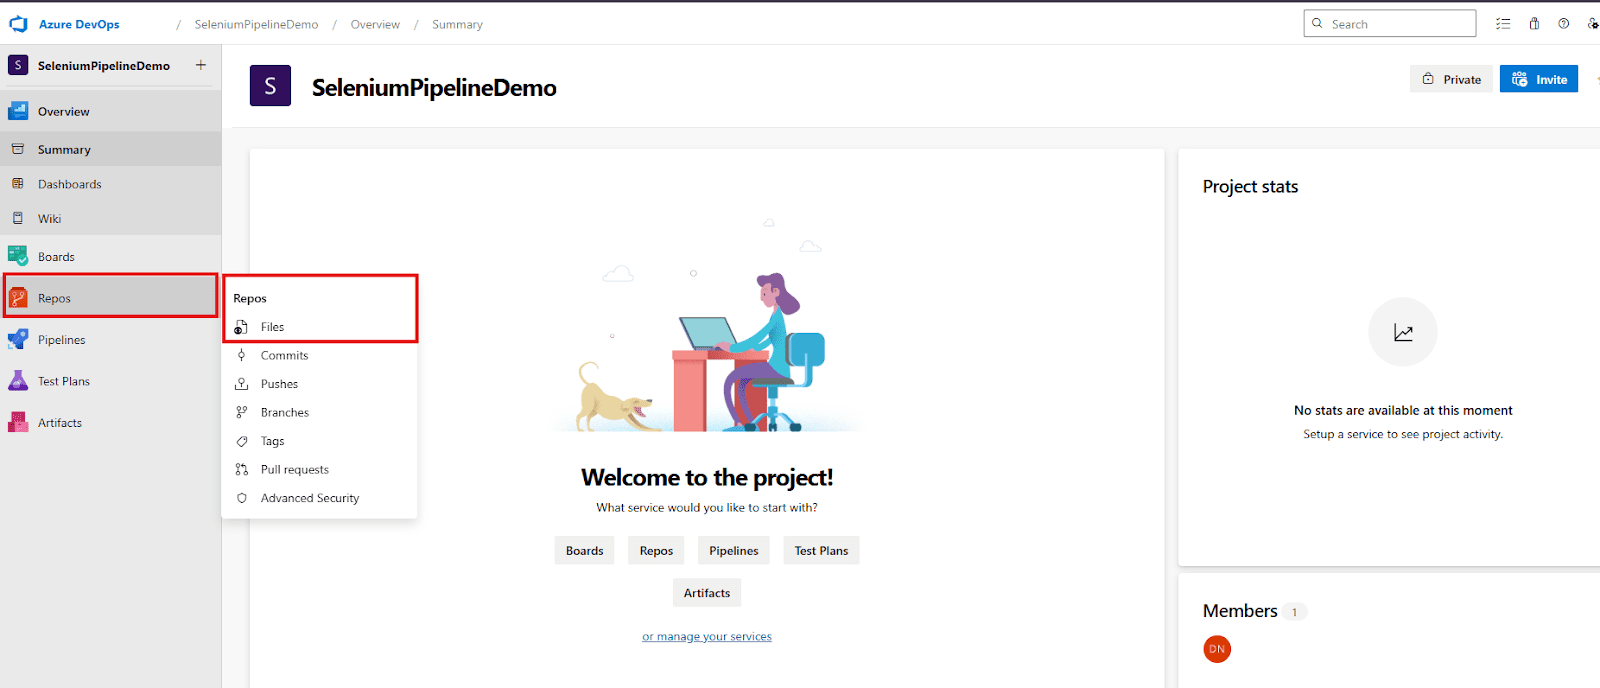
Initialize Repository: If this is a brand new repository, Azure DevOps will guide you through creating your first repository and will present you with the Git clone URL along with helpful instructions on how to initialize your local project and push your first commit. This URL is crucial for connecting your local code to the cloud.
Step 2: Push Your Selenium Project from Visual Studio
Now, let’s get your local Selenium project from your development machine into your newly created Azure Repo.
For best practice, we’ll first create and switch to a dedicated feature branch for your work before pushing.
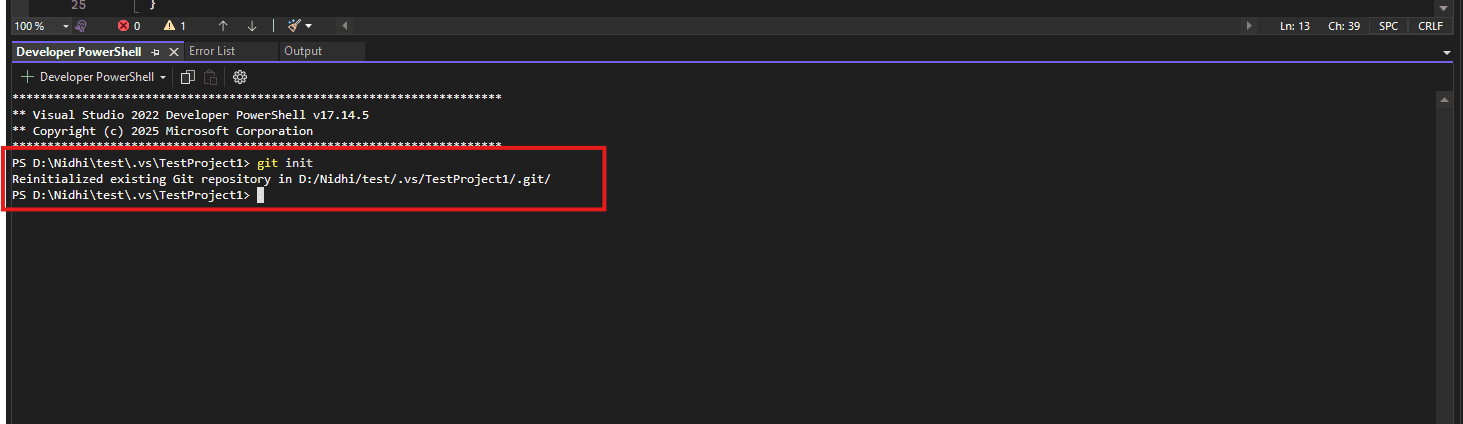
Initialize Git (if not already):
If your local project folder isn’t already a Git repository (i.e., it doesn’t have a .git folder), you’ll need to initialize it.
- Open Terminal or Visual Studio’s Git Integration: You can use the command prompt/terminal or leverage Visual Studio’s powerful built-in Git capabilities (Team Explorer or Git Changes window). For command-line users, navigate to the root folder of your SeleniumAutomationTests project.
- Execute Git Commands:
git init : Initializes a new local Git repository in your project folder.
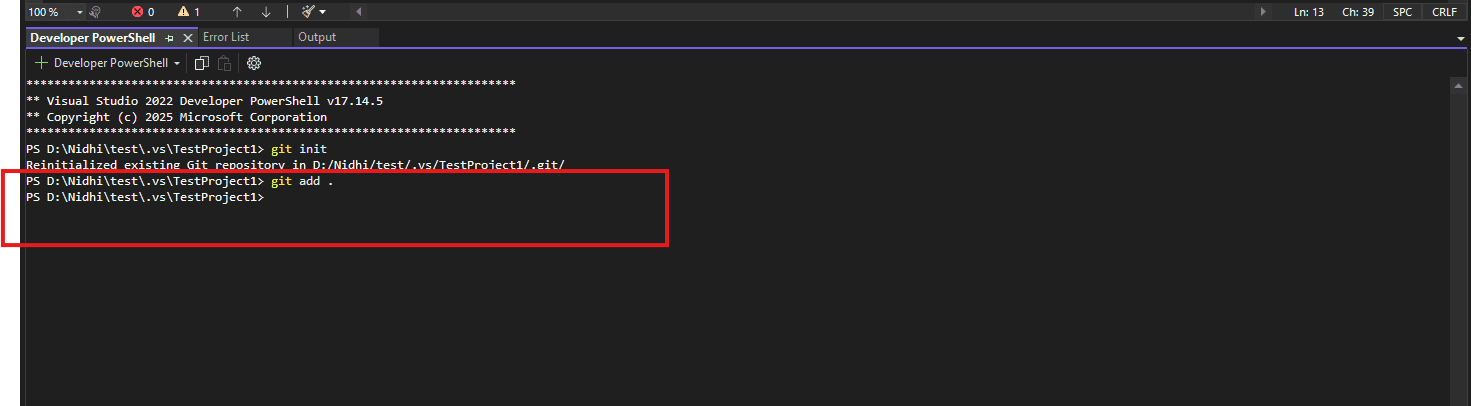
git add : Stages all changes (new and modified files) in the current directory for the next commit.
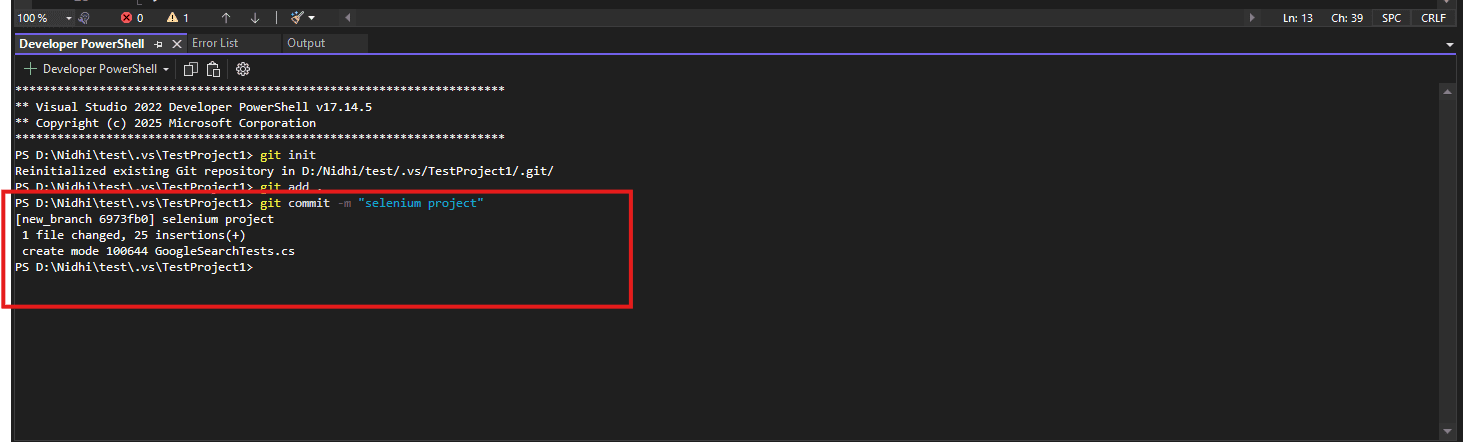
git commit -m “Initial commit – Selenium project” : Creates a new commit, saving a snapshot of your staged files with a descriptive message.
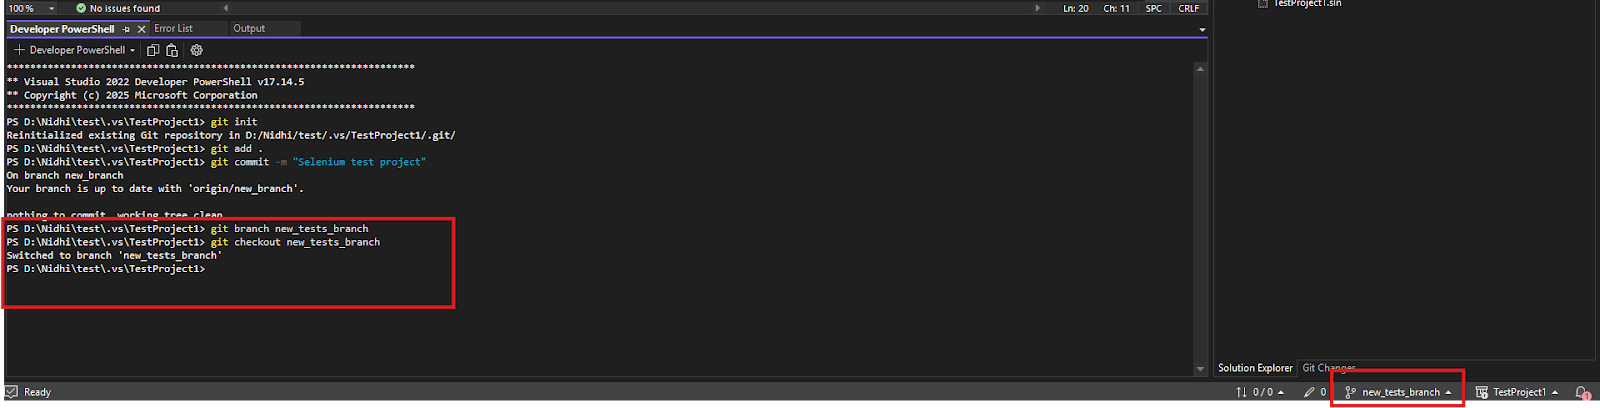
git branch new_tests_branch : Creates a new local branch (replace ‘new_tests_branch’ with your desired branch name)
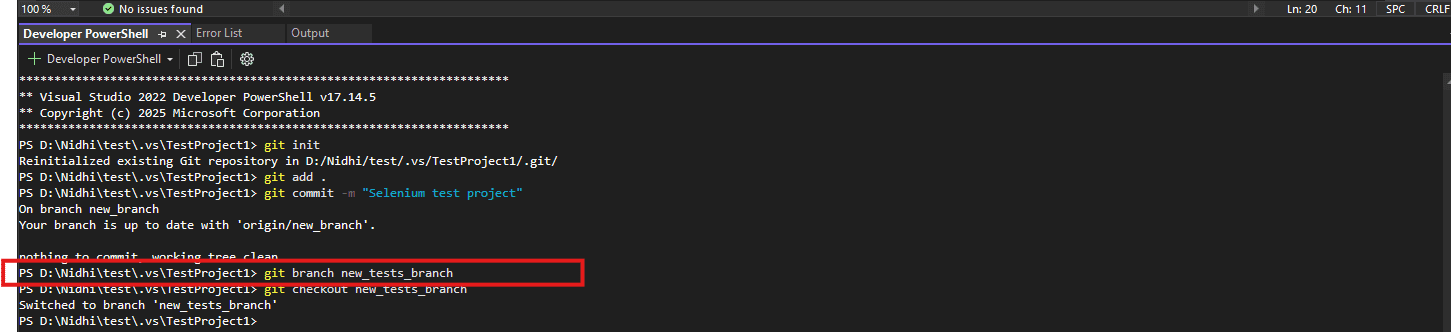
git checkout new_tests_branch : Switches to your new feature branch # You can also combine the last two into one: git checkout -b new_tests_branch
Connect to Azure Repo
Now, you need to tell your local Git repository where its remote counterpart is located.
- Copy the Git clone URL: From the Azure DevOps Repos section (as seen in Step 1), copy the HTTPS or SSH Git clone URL for your repository.
- Add the remote origin: In your terminal (or using Visual Studio’s Git features), execute:
git remote add origin https://dev.azure.com/your-org/your-project/_git/your-repoNote: Replace https://dev.azure.com/your-org/your-project/_git/your-repo with the actual URL you copied from Azure DevOps. This command sets up a remote alias named origin that points to your Azure Repo.
Push the code:
Finally, send your local commits to the remote Azure Repo.
git push -u origin new_tests_branch : Change new_tests_branch to your new branch name
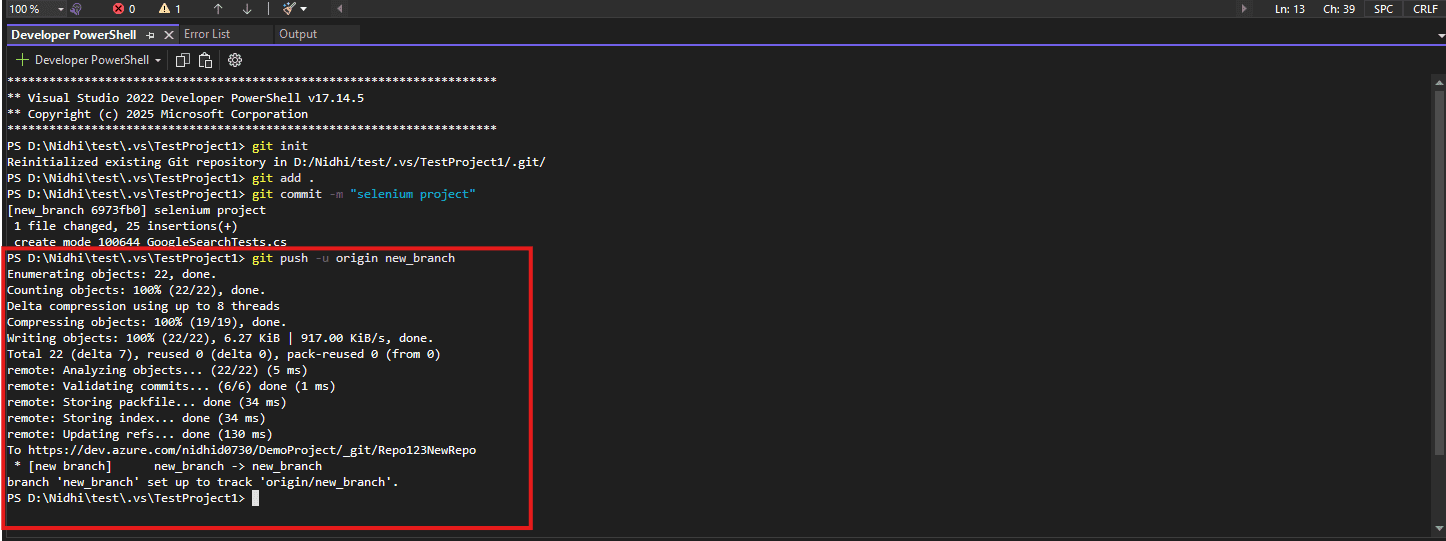
Note: The -u flag sets the upstream branch, so future git push and git pull commands will work without specifying origin and the branch name (when you are on that specific branch).
After executing these commands, your Selenium test code will be uploaded and visible within Azure Repos in your browser on the new_tests_branch branch.
Creating a Pull Request in Azure DevOps: Your Code Review Gateway
After pushing your code to a dedicated feature branch (like new_tests_branch), the next logical step in a collaborative development environment is to create a Pull Request (PR). A Pull Request serves as a formal proposal to merge your changes from your feature branch into a target branch, typically a main development line like main or master.
Why are Pull Requests crucial?
- Code Review: They provide a structured opportunity for teammates to review your code, offer feedback, and ensure quality and adherence to coding standards.
- Collaboration: PRs facilitate discussion and knowledge sharing within the team.
- Quality Gates: Most importantly for CI/CD, Pull Requests can trigger automated processes like your Azure Pipeline to build the code and run your Selenium tests before the merge. This acts as a critical “quality gate,” preventing breaking changes or regressions from entering your main codebase.
Let’s walk through the steps to create a Pull Request in Azure DevOps:
Step 1: Navigate to Pull Requests
- Log in to Azure DevOps: Open your web browser and go to https://dev.azure.com, then log in with your credentials.
- Select Your Project: Navigate to your specific Azure DevOps project.
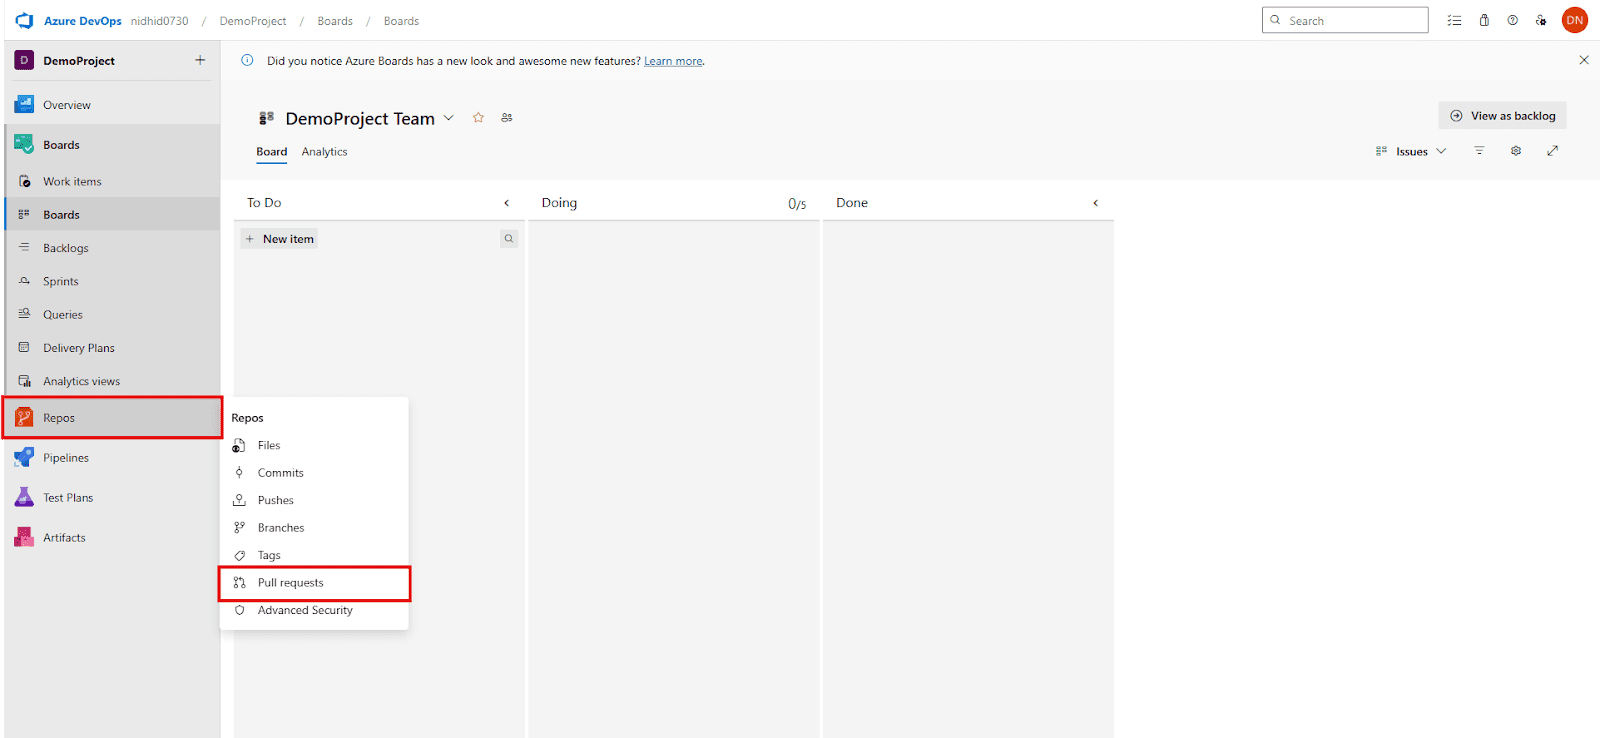
- Access Pull Requests: In the left-hand navigation sidebar, click on Repos, then select Pull requests.
Step 2: Initiate a New Pull Request
On the “Pull requests” page, click the “New pull request” button, usually located in the top right corner.
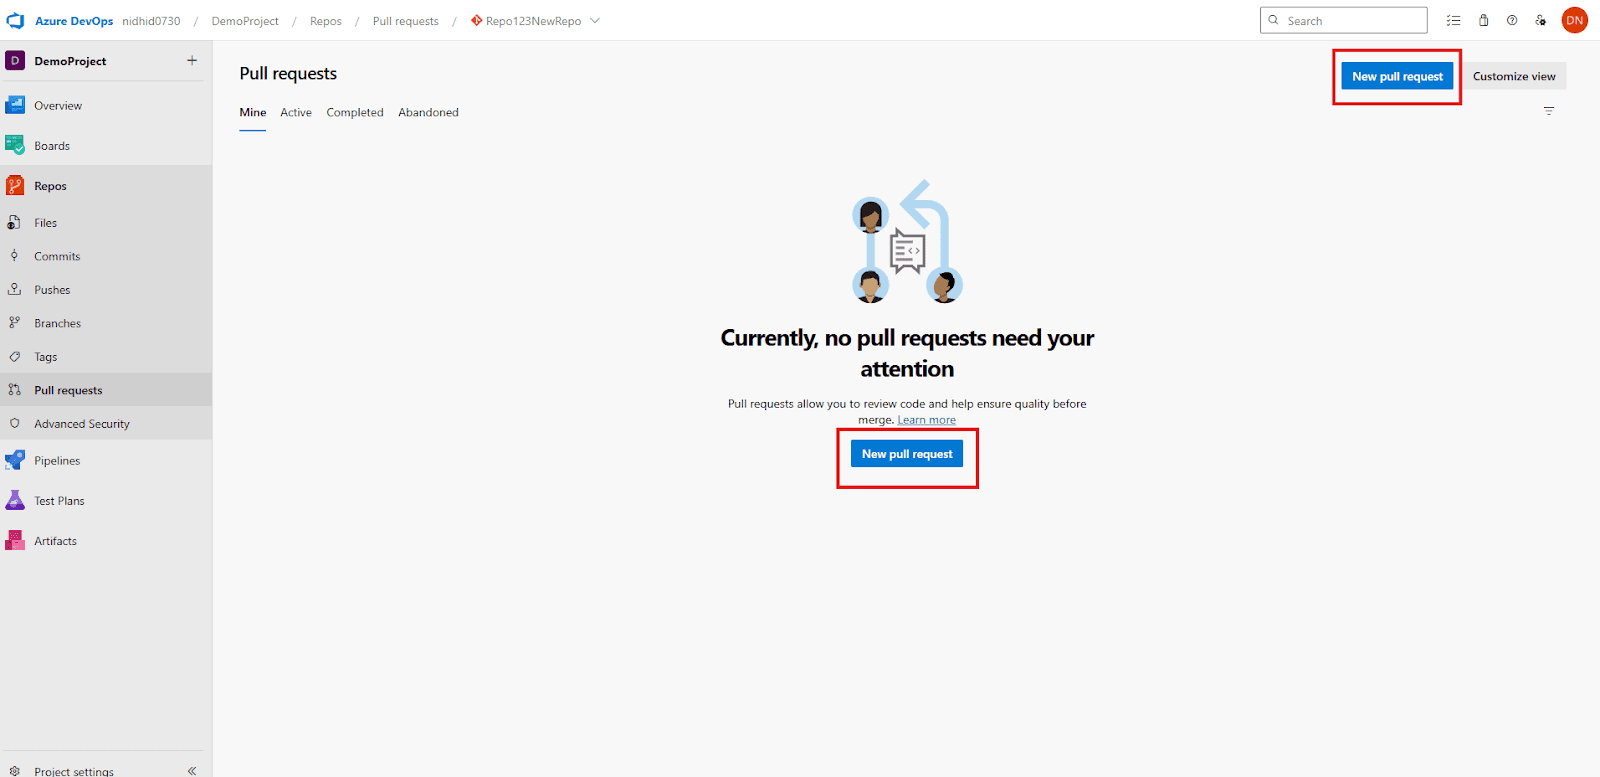
Automatic Detection (Optional): Often, after you push a new branch, Azure DevOps will even display a banner directly on the “Files” tab of your repo, prompting you to “Create a pull request” for your recently pushed branch. You can click that for a shortcut.
Step 3: Select Source and Target Branches
Once you start a new PR, you’ll need to specify which branches you’re comparing:
Source Branch: From the dropdown, select your feature branch (e.g., new_tests_branch). This is the branch containing the changes you want to propose.
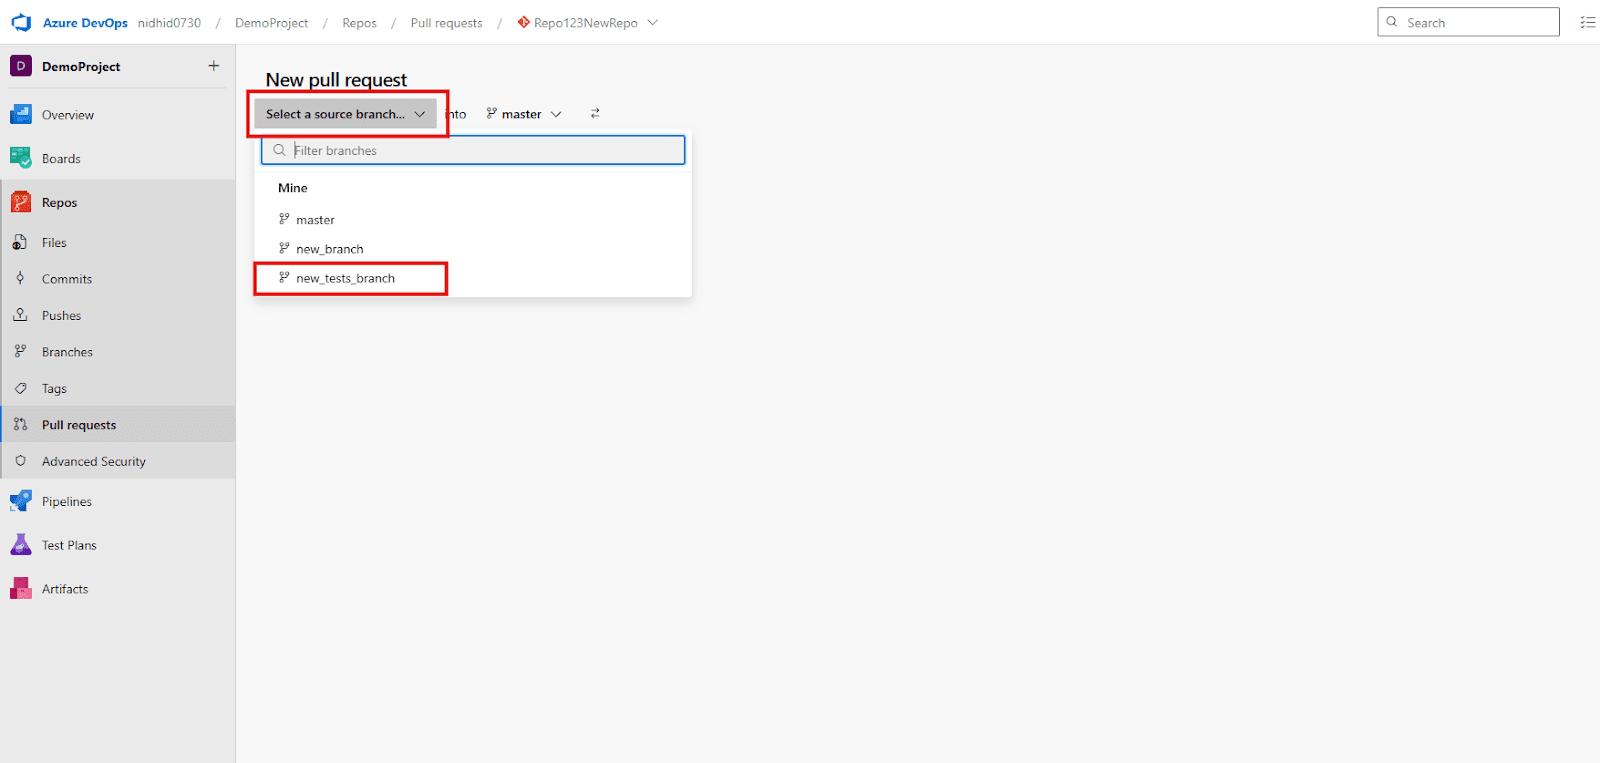
Target Branch: From the dropdown, select the main development branch you intend to merge into (e.g., main or master). This is where your changes will eventually land.
Azure DevOps will then display a comparison, showing all the new commits and file changes between your source and target branches.
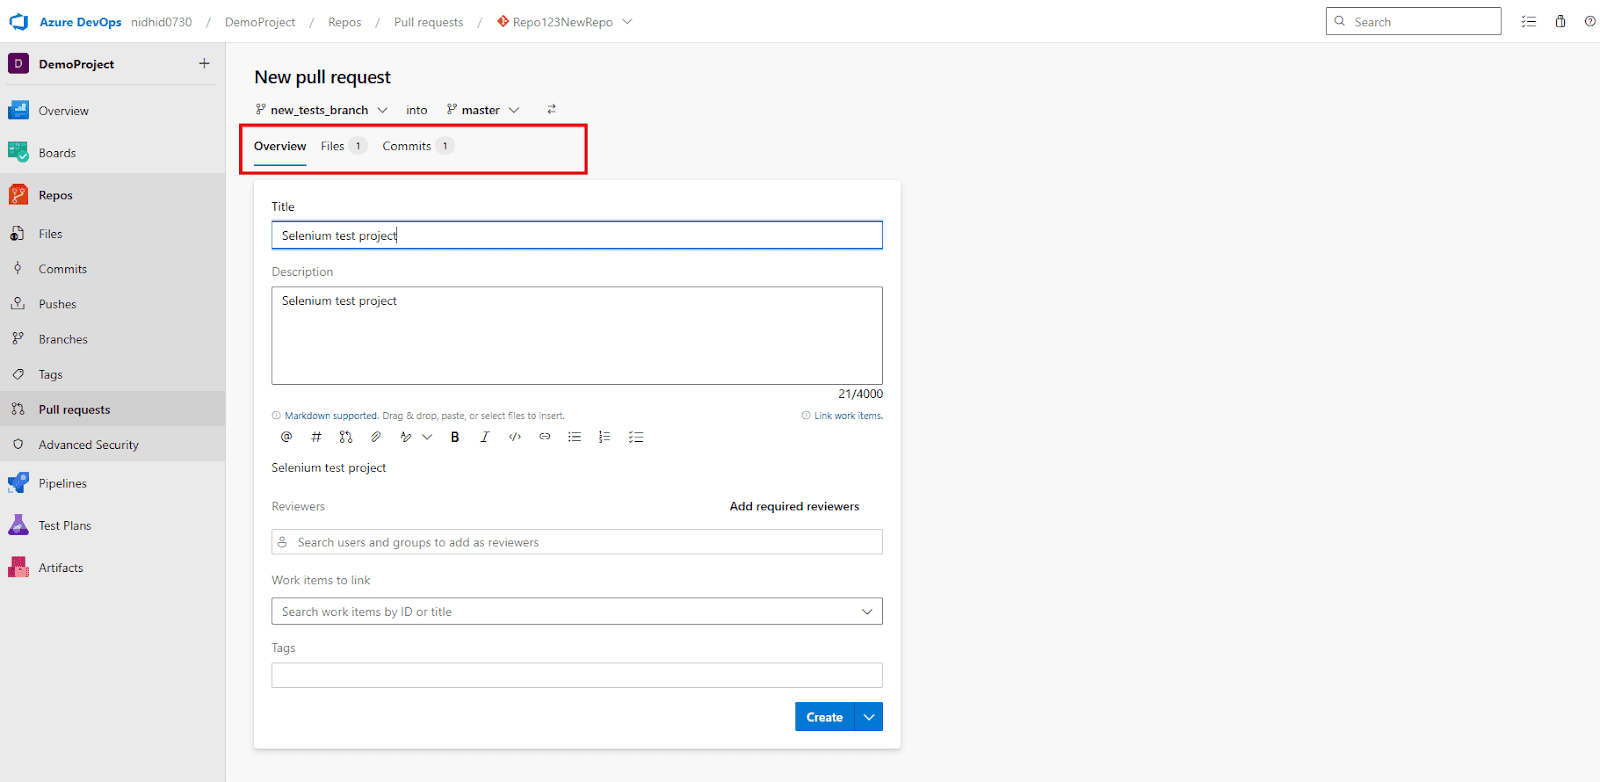
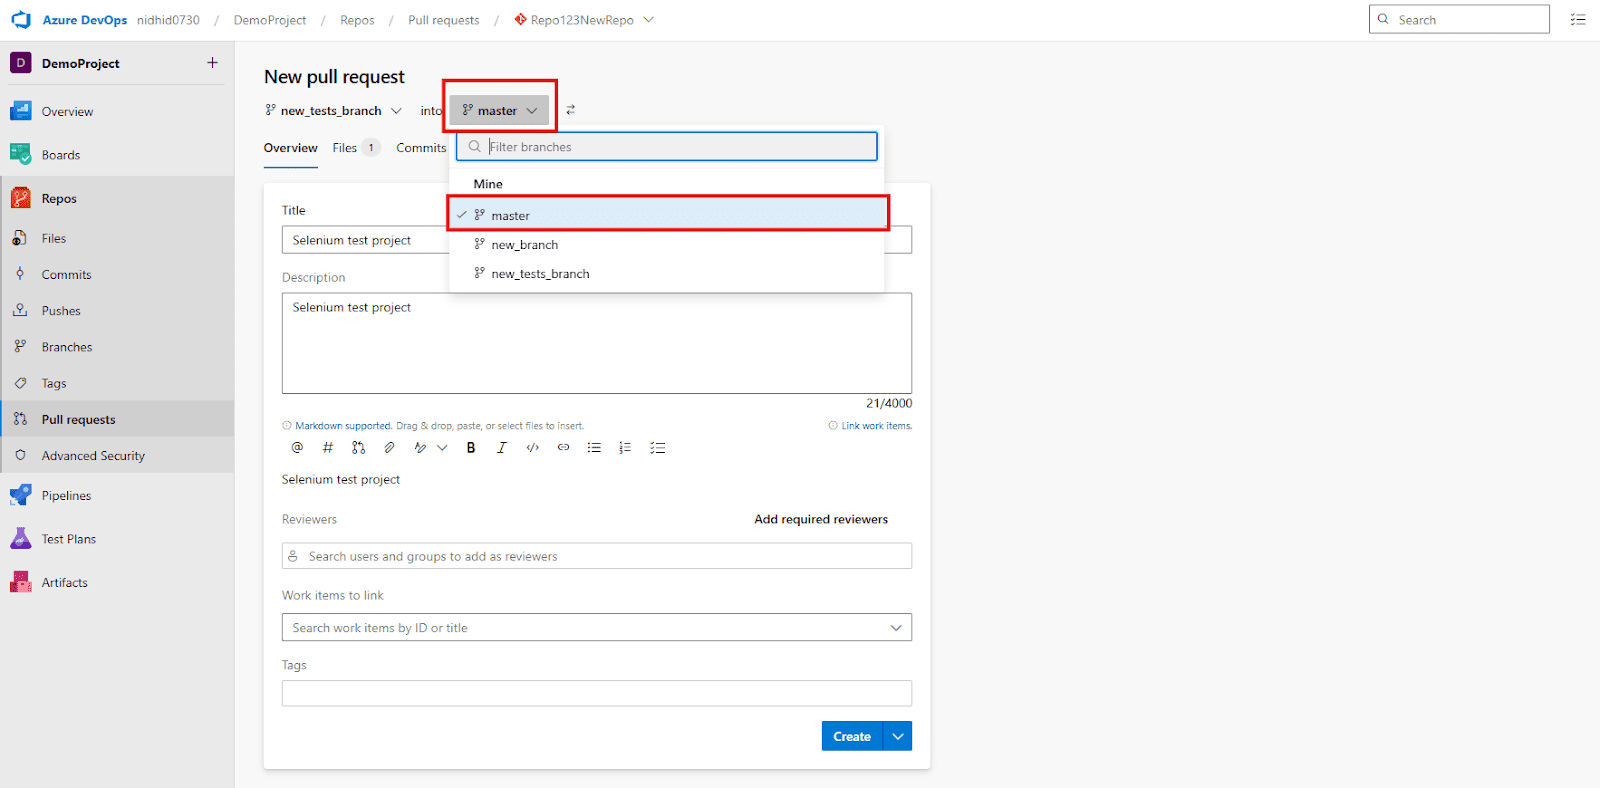
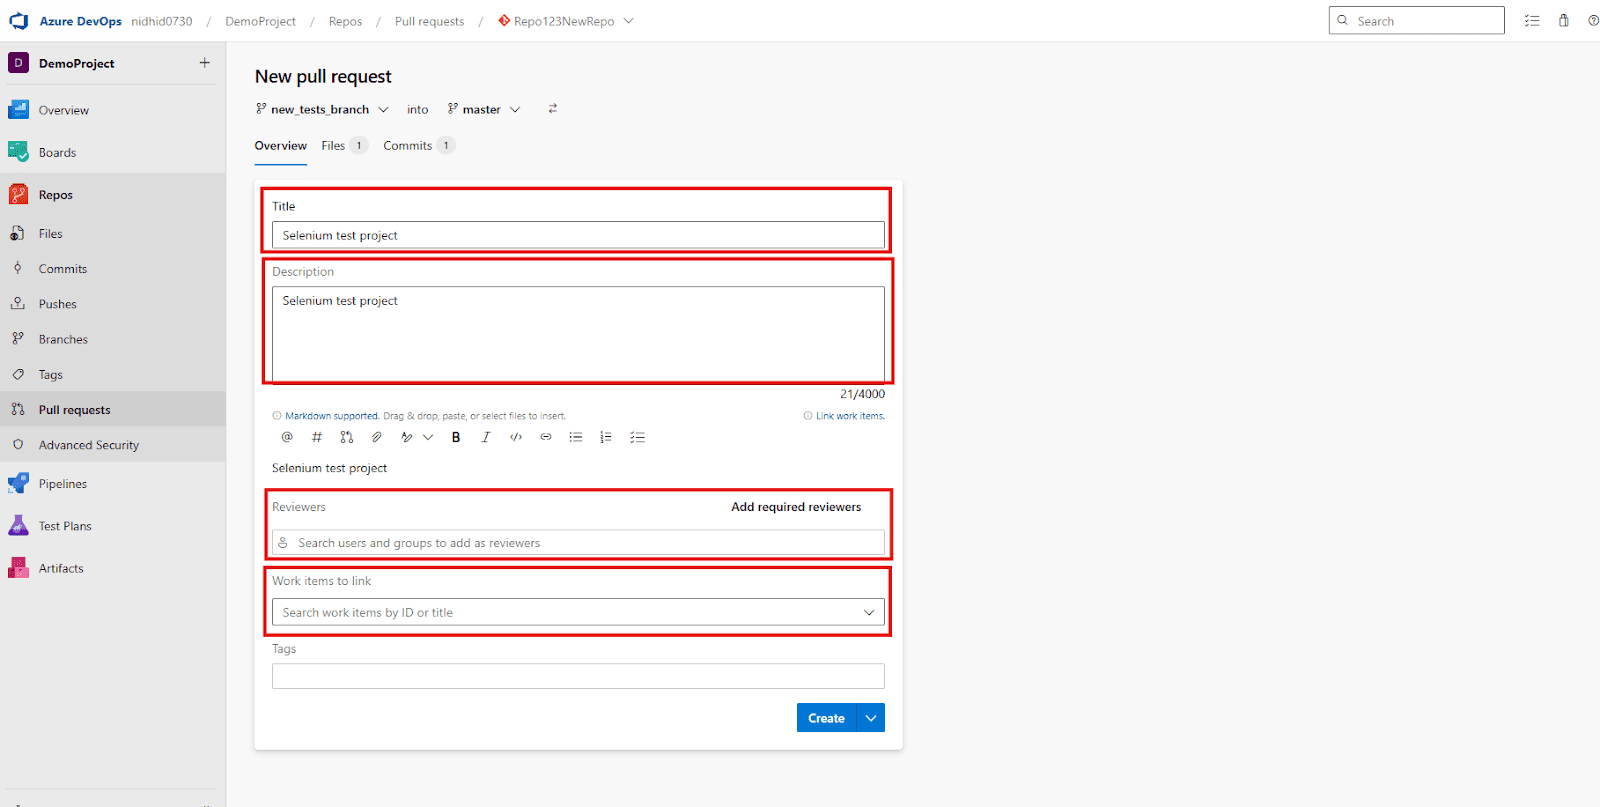
Step 4: Add Details to Your Pull Request
Before creating, fill in the essential details for your PR:
- Title: Provide a clear and concise title that summarizes the purpose of your changes (e.g., “Feature: Implement Google Search Selenium Test” or “Bugfix: Resolve Login Issue with New UI”).
- Description: Write a detailed explanation of what changes you’ve made, why they were necessary, and any specific areas you’d like your reviewers to focus on. Mention that you’ve added or updated Selenium tests for a particular feature.
- Reviewers: Add team members who are responsible for reviewing your code. You can search for them by name.
- Linked Work Items (Optional but Recommended): If your changes are related to any user stories, tasks, or bugs in Azure Boards, you can link them here. This provides traceability between your code, tests, and project management items.
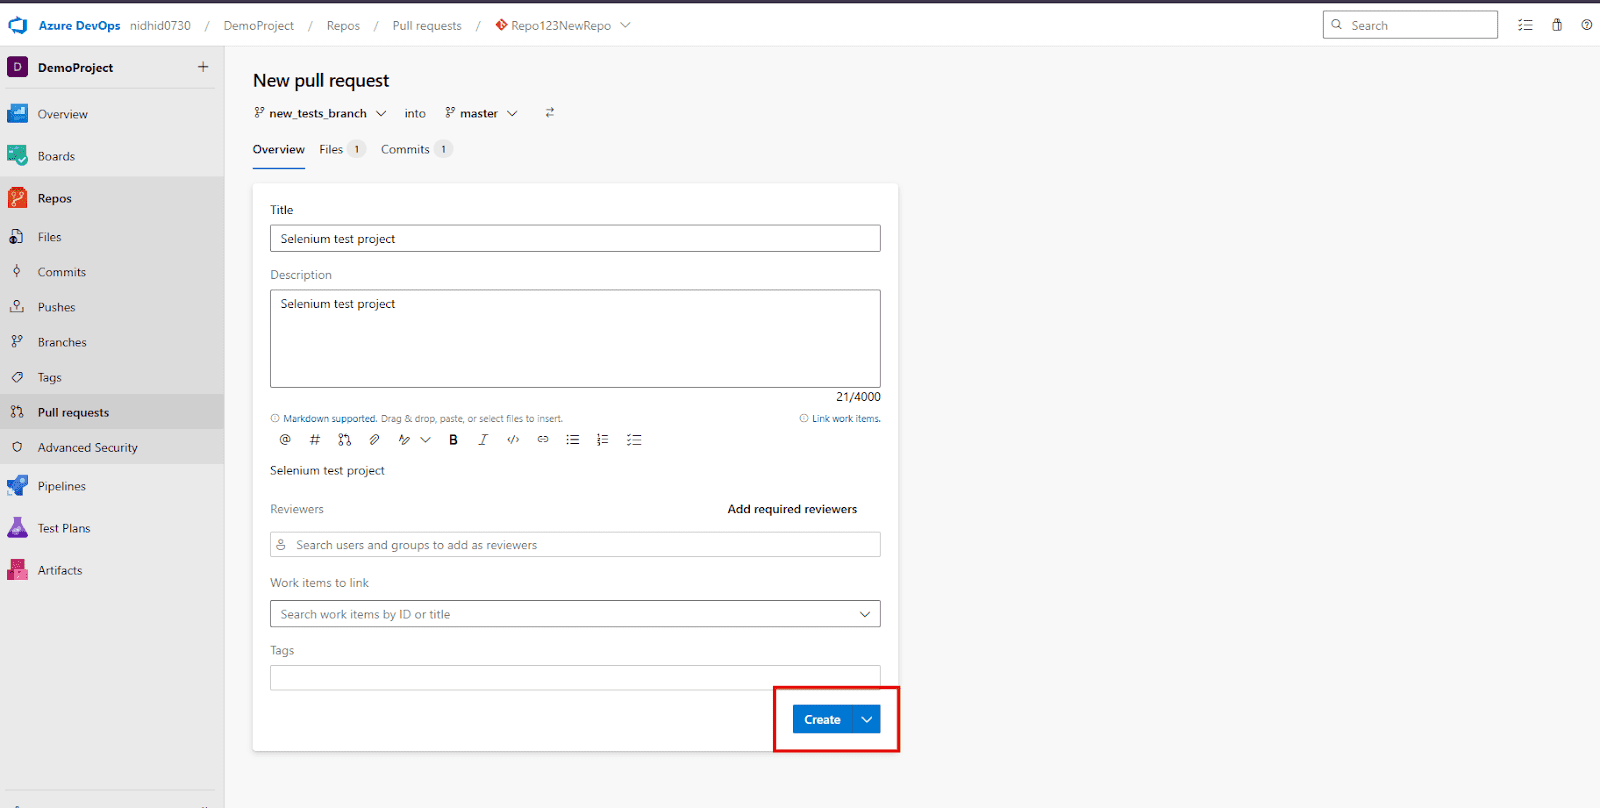
Step 5: Create the Pull Request
Once all the details are filled, click the “Create” button.
Your Pull Request will now be created and will appear in the list of active PRs. If you have configured branch policies, your Azure Pipeline might automatically start running, executing your Selenium tests against the proposed changes. This immediate feedback helps you identify any issues before your code even gets merged, ensuring a high-quality codebase.
Approving and Merging Your Pull Request: Integrating Your Quality-Assured Code
Once a Pull Request is created, it enters a critical phase where code reviews happen, automated checks run, and ultimately, a decision is made to integrate the changes into the target branch (e.g., main or master). This process ensures that only validated and approved code lands in your primary development lines.
Step 1: Reviewing the Pull Request and Automated Checks
- Code Review by Teammates: Reviewers added to the Pull Request will examine your code changes, provide feedback, suggest improvements, or ask clarifying questions. This iterative process helps refine the code.
- Automated Pipeline Execution: Crucially, if you have configured branch policies (which we’ll touch upon briefly in the next section’s YAML setup), your Azure Pipeline will automatically trigger on the Pull Request.
- This means your Selenium tests will run against the combined code of your feature branch and the target branch.
- You can monitor the pipeline’s progress directly within the Pull Request details in Azure DevOps. Look for the “Checks” or “Policies” section to see the status of your build and test runs.
- Successful Test Runs are Key: A successful pipeline run, particularly with all Selenium tests passing, provides strong confidence that your changes haven’t introduced regressions.
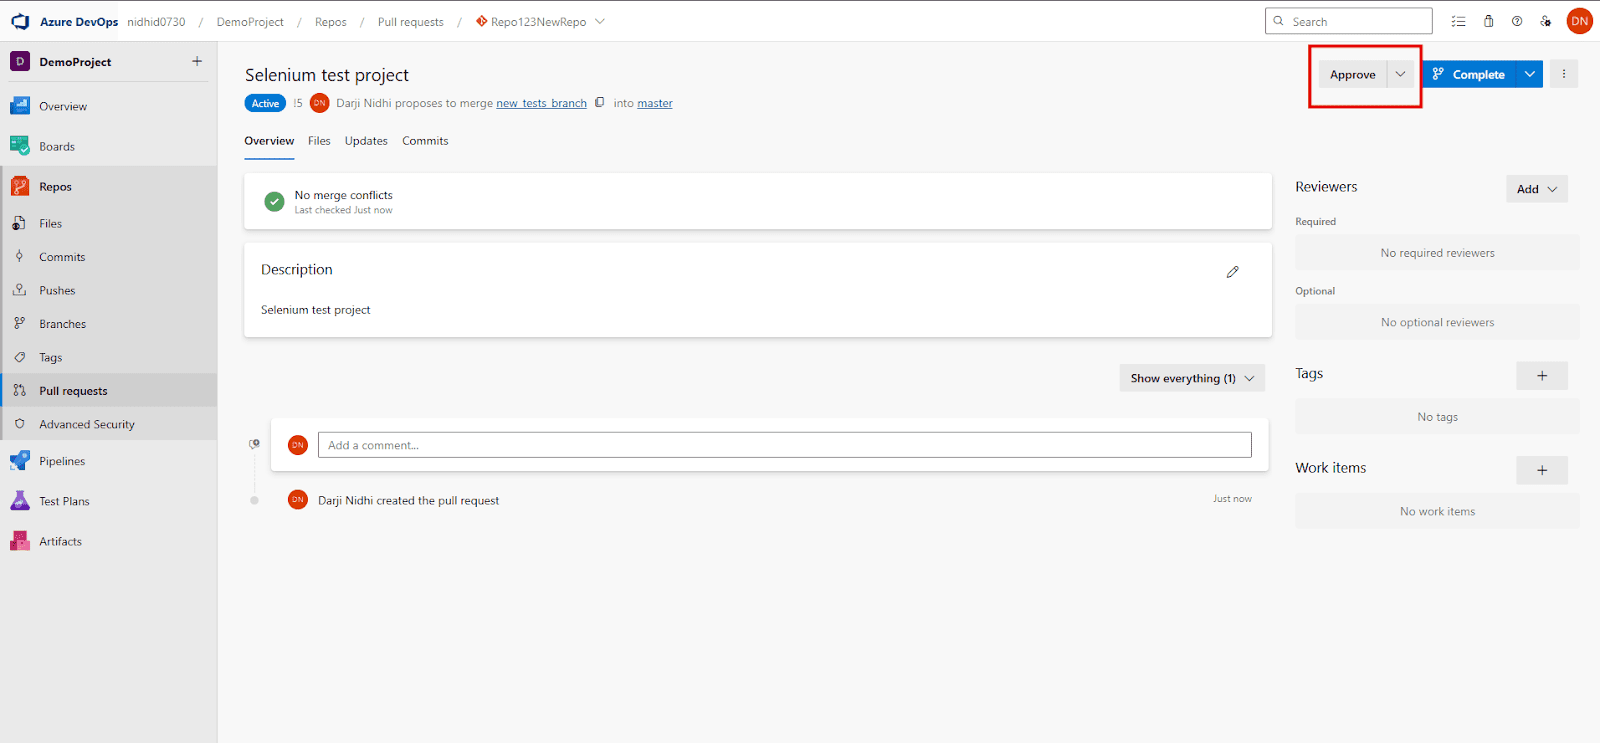
Step 2: Meeting Branch Policies and Gaining Approvals
Before a Pull Request can be completed (merged), it often needs to satisfy certain Branch Policies. These policies are pre-defined rules that ensure code quality and team collaboration. Common policies include:
- Minimum Number of Reviewers: Requires a certain number of approved reviews before merging.
- Successful Build Validation: Requires a linked build pipeline (like your Selenium test pipeline) to pass successfully.
- No Comment Resolution: Ensures all comments on the PR have been resolved.
- Linked Work Items: Requires the PR to be linked to an Azure Board work item.
- Gaining Approval: Once reviewers are satisfied and all automated checks (including your Selenium tests) have passed, reviewers will typically click the “Approve” button on the Pull Request. You might also have a policy requiring the original author to approve their own changes if someone else pushed them.
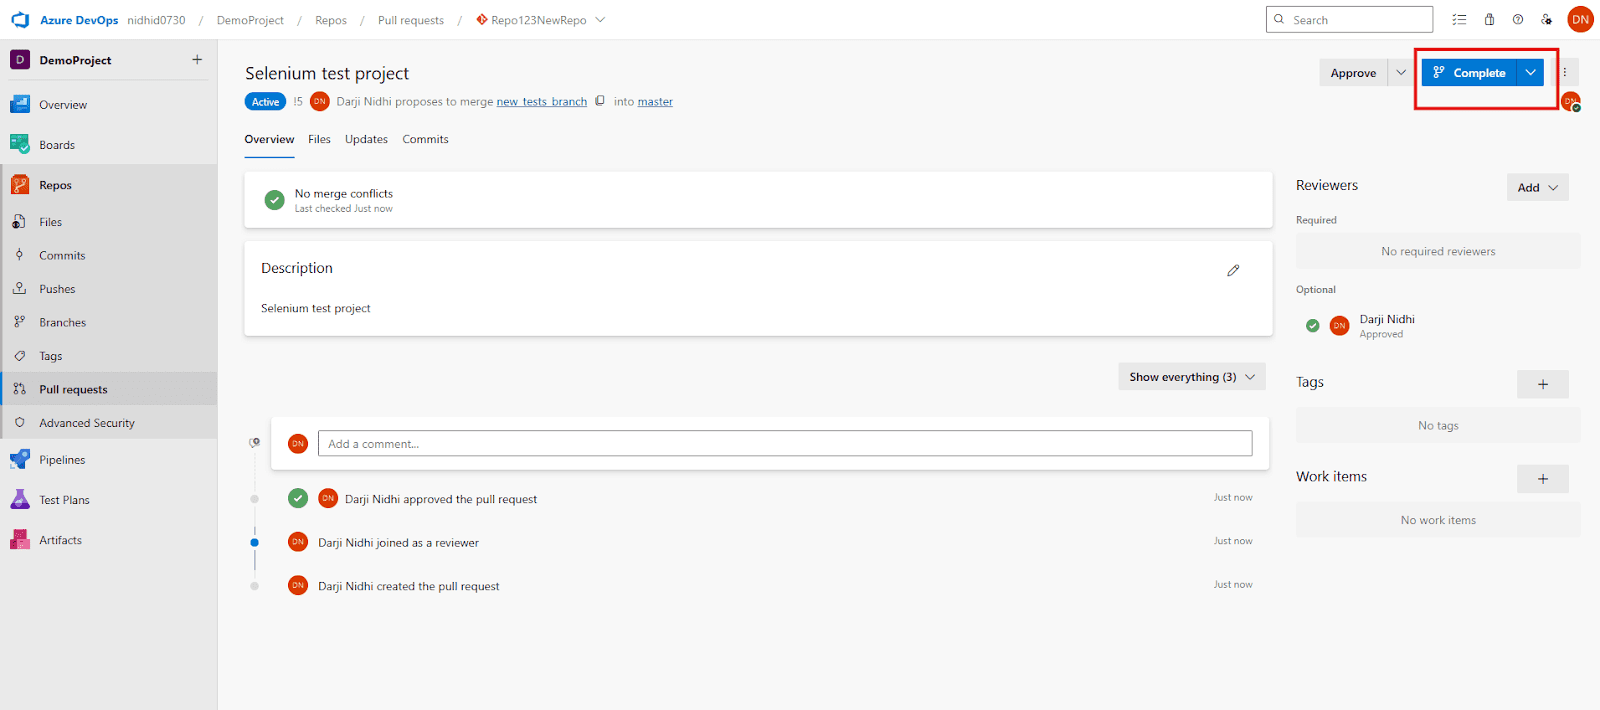
Step 3: Completing (Merging) the Pull Request
Once all required approvals are obtained and all branch policies are satisfied, the Pull Request is ready to be merged:
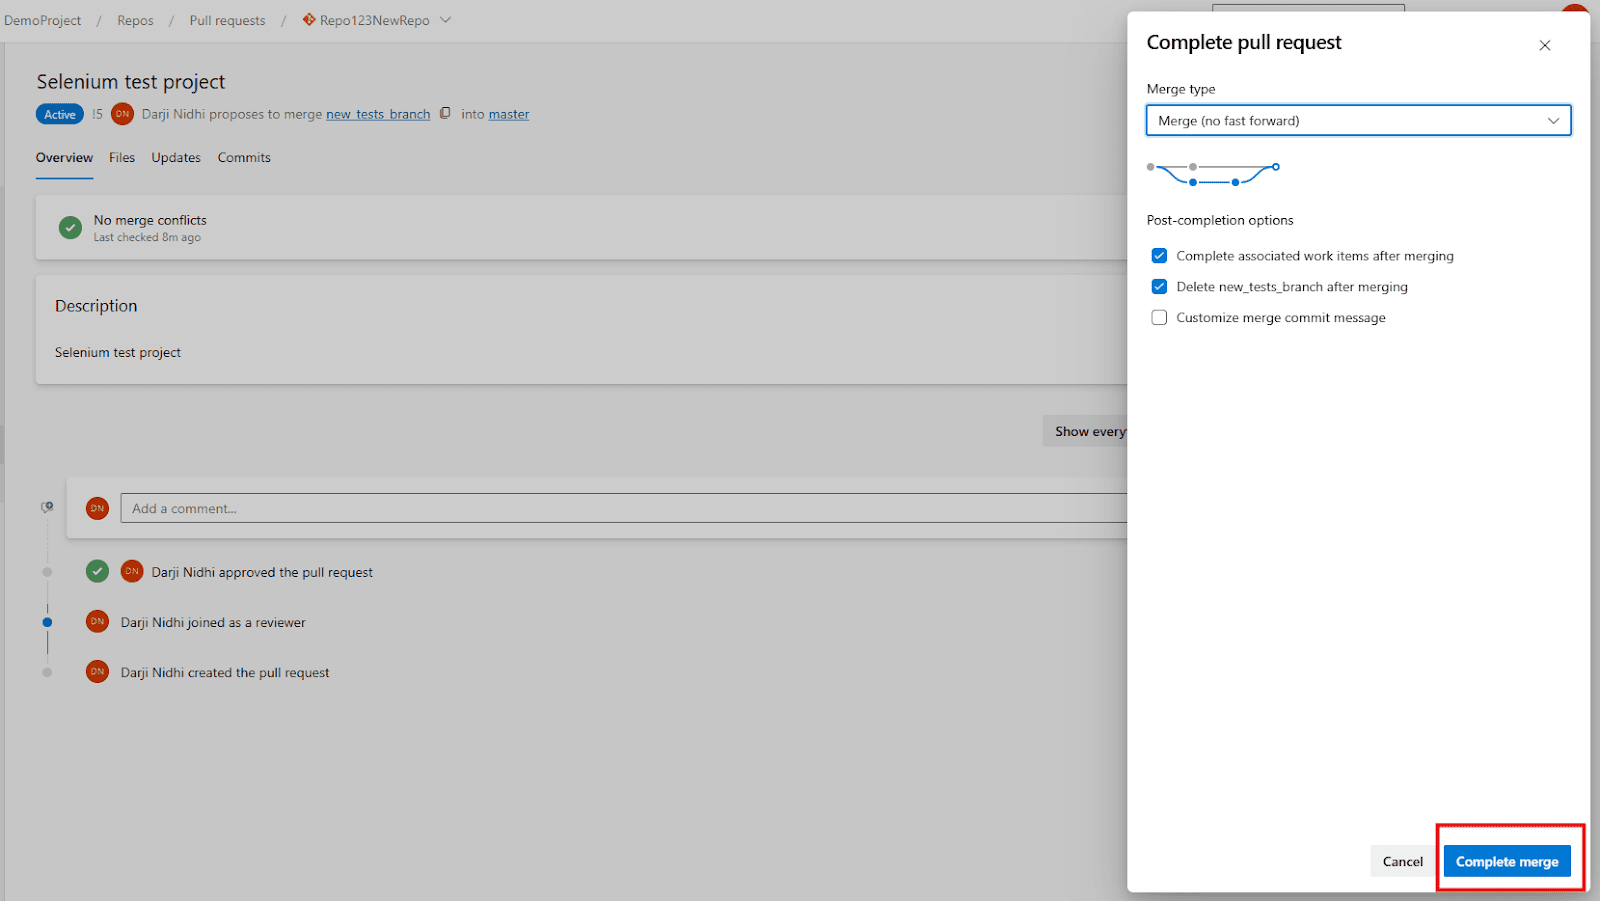
Click “Complete”: The “Complete” button will become active in the top right corner of the Pull Request details page. Click it to initiate the merge process.
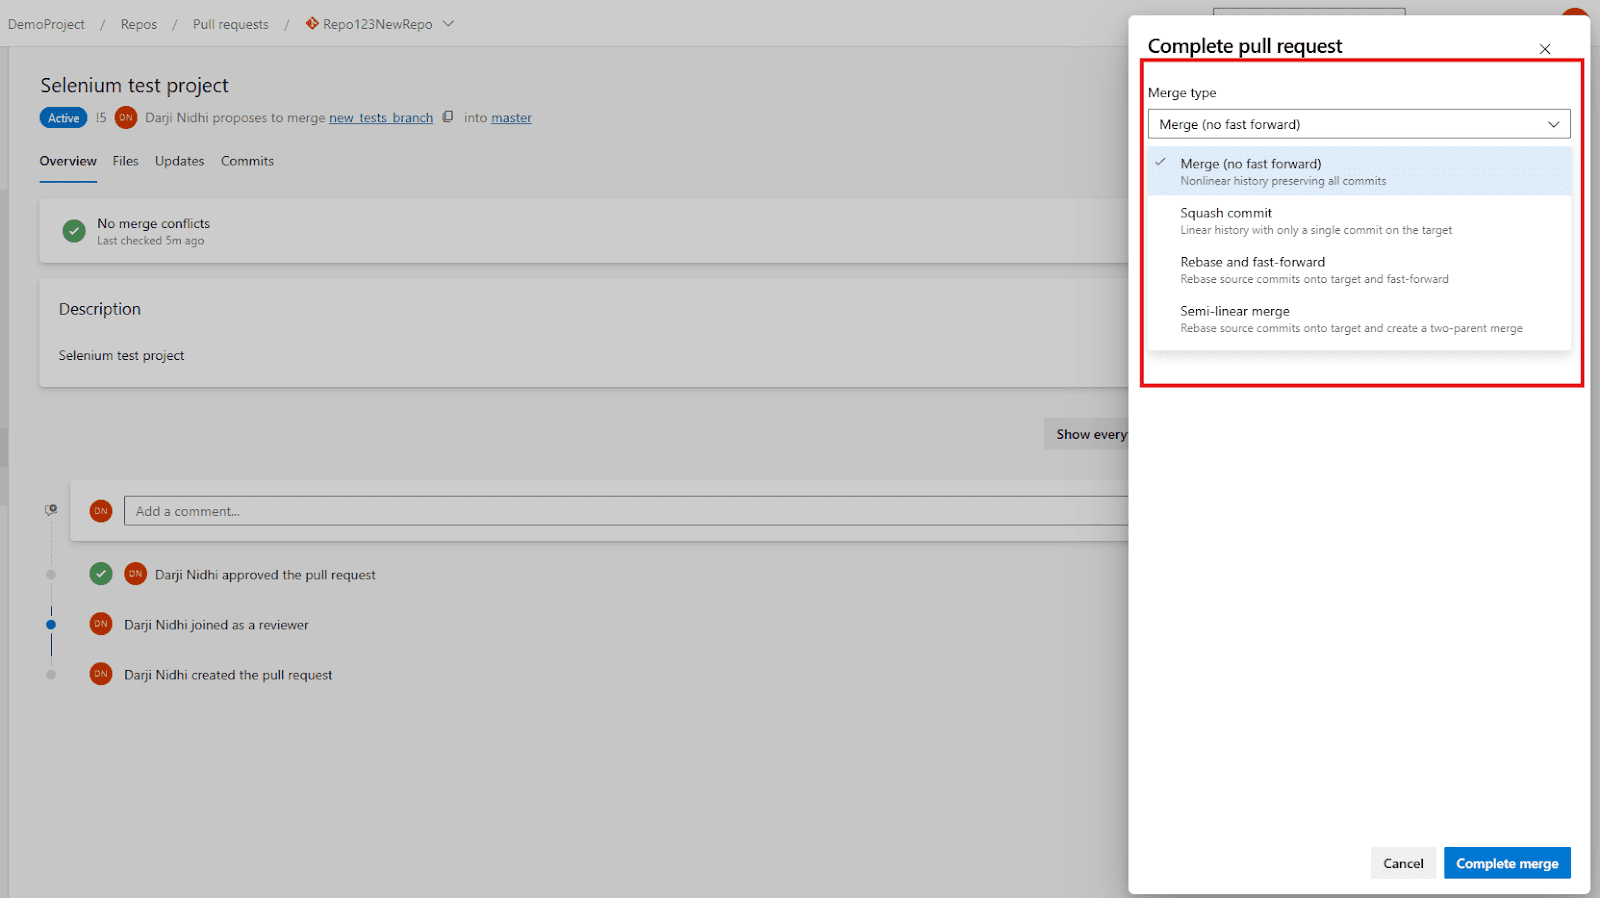
Choose Merge Options: Azure DevOps offers several merge strategies:
- Merge (No fast-forward): This is often the default. It creates a new merge commit, preserving the history of your feature branch. This is generally recommended as it clearly shows when and how the feature branch was integrated.
- Squash Commit: This combines all commits from your feature branch into a single commit on the target branch. Useful for keeping main history cleaner, especially for small feature branches.
- Rebase and Fast-Forward: Reapplies your feature branch commits on top of the latest main commit. This results in a linear history but can rewrite history.
- Semi-linear Merge: This strategy combines the benefits of both Rebase and Fast-Forward and Merge (No fast-forward). It performs a rebase of the source branch commits onto the tip of the target branch, and then performs a fast-forward merge if possible. If a fast-forward merge isn’t possible (e.g., due to conflicts), it creates a merge commit. The key benefit is that it ensures a largely linear history while still preserving merge commits for clarity when needed, providing a good balance between a clean history and traceability.
Delete Source Branch (Optional but Recommended): You’ll typically see an option to “Delete new_tests_branch after merging.” It’s good practice to select this, as feature branches are usually short-lived and serve their purpose once merged.
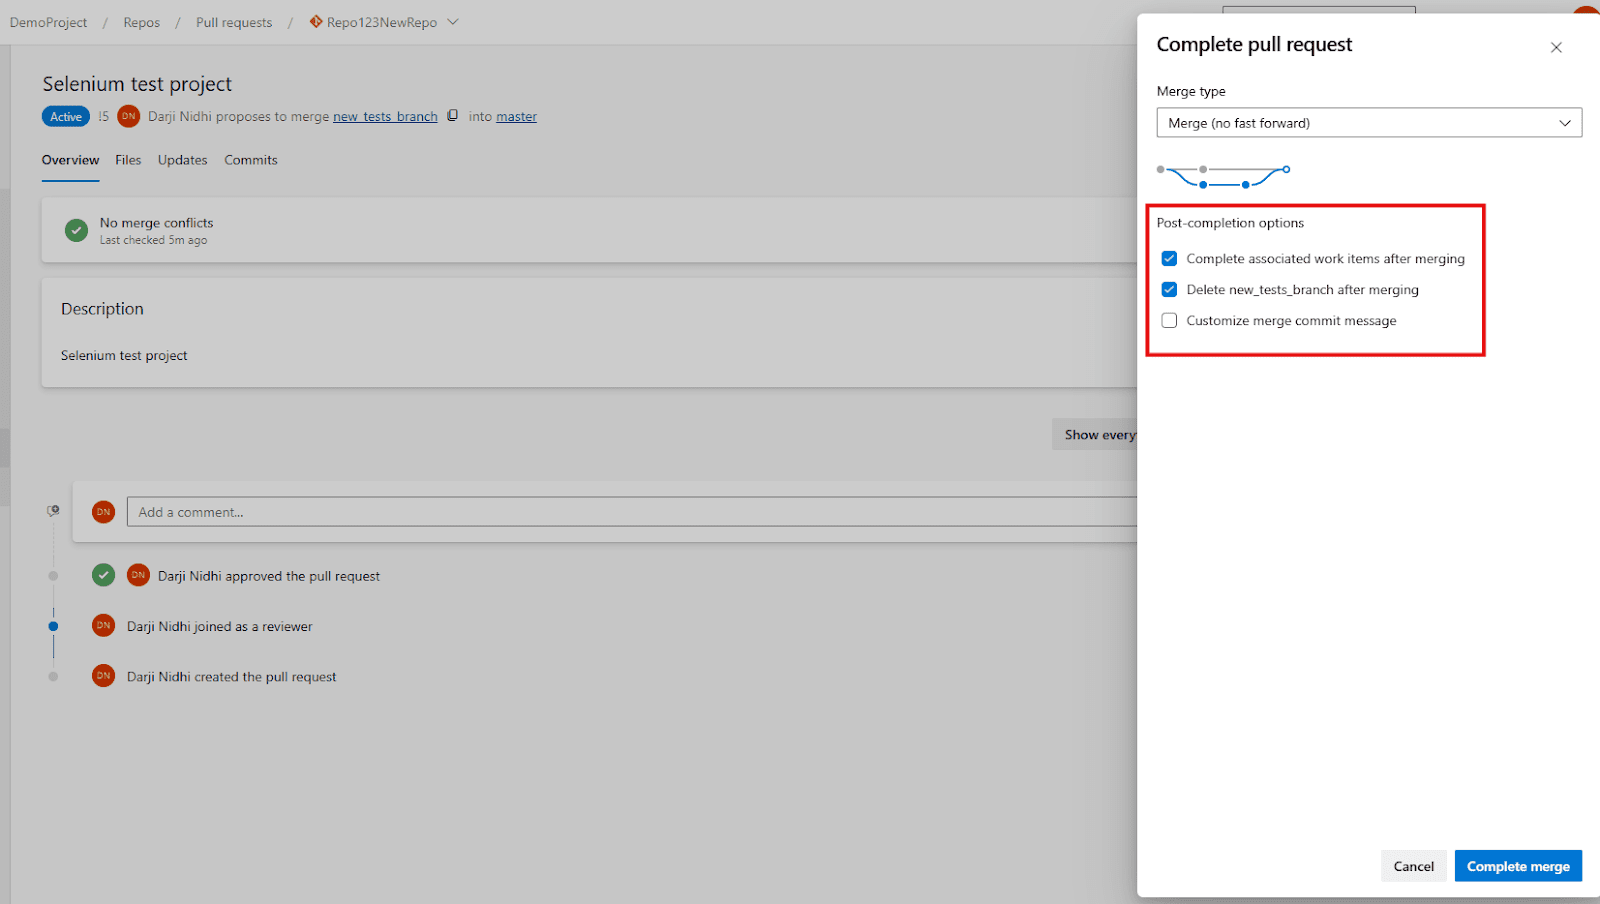
Complete Merge: Confirm your chosen options and click “Complete merge.“
Your changes, including your newly integrated Selenium tests, are now part of the main (or master) branch. This concludes the cycle of developing on a feature branch, ensuring quality through PRs and automated tests, and integrating safely into your main codebase.
Best Practices for Project Structure
A well-organized project structure is paramount for test automation maintainability, especially as your test suite grows. Adhering to logical folder and file arrangements makes it easier for team members to navigate, understand, and contribute to the project.
| Folder/File | Purpose |
| Tests/ | This dedicated folder should contain all your test case files, organized into logical sub-folders based on features or modules (e.g., Tests/Login, Tests/Products). |
| Pages/ | Implement the Page Object Model (POM) here. Each class in this folder represents a distinct web page or a significant component of a page (e.g., LoginPage.cs, ProductPage.cs). This pattern makes tests more readable and maintainable. |
| Drivers/ | An optional folder where you might manually place browser driver executables (e.g., chromedriver.exe, geckodriver.exe) if you’re not using WebDriverManager. However, WebDriverManager largely negates the need for this. |
| Utilities/ | House common helper methods, reusable functions, or shared logic that can be utilized across multiple tests or page objects. Examples include custom explicit waits, logging functionalities, or data readers. |
| app.config | Crucial for storing global configuration settings, such as base URLs for different environments (Development, Staging, Production), default timeouts, or user credentials. This keeps sensitive or environment-specific data out of your code. |
| README.md | A vital file providing comprehensive project instructions, setup guides, dependencies, how to run tests locally, and any important notes for new contributors. |
| .gitignore | A Git configuration file that specifies intentionally untracked files and directories to ignore. It’s essential to list folders like bin/, obj/, and any drivers/ folder (if you manually manage drivers) to keep your repository clean and avoid committing unnecessary build artifacts or executables. |
Summary
- You created a Git repo in Azure DevOps.
- Pushed your Selenium project using Git commands.
- Learned how to organize your test automation project in a clean structure.
Now that your code is in Azure Repos, we’re ready to set up Azure Pipelines to run tests automatically!
Setting Up an Azure Pipeline (YAML)
With your Selenium test code now securely residing in Azure Repos, the pivotal next step is to configure Azure Pipelines to automate the execution of those tests. This automation is the very heart of Continuous Integration (CI), meaning your tests will automatically spring into action whenever a code change is pushed, providing instant feedback on the health of your application.
Let’s delve into creating this automated workflow, breaking it down into simple, manageable steps.
What is a Pipeline?
A Pipeline, within the sophisticated landscape of Continuous Integration/Continuous Delivery (CI/CD), is an exquisitely automated and fully configurable workflow that meticulously defines the sequence of operations necessary to deliver new software or updates. Envision it as an advanced, automated assembly line specifically tailored for your code.
It’s a precisely ordered series of predefined steps that are executed automatically whenever specific triggering actions occur. These actions are typically closely linked to code changes within your version control system.
Fundamentally, a pipeline allows you to:
- Build your code: This often initiates the process, where the pipeline automatically compiles your application’s source code into executable binaries or other deployable artifacts.
- Run tests: Crucially, after a successful build, the pipeline automatically executes your suite of automated tests, ensuring the quality of your recent changes.
- Publish results: Once tests are complete, the pipeline gathers and publishes the outcomes, making them easily accessible for review and analysis.
The immense power and flexibility of this entire automated process are elegantly defined and controlled through a YAML (YAML Ain’t Markup Language) file, which resides alongside your code, ensuring version control and consistency.
Step 1: Create the Pipeline in Azure DevOps
Initiating your pipeline setup within the Azure DevOps portal is a guided process:
- Access Your Project: Navigate to your specific Azure DevOps project in your web browser.
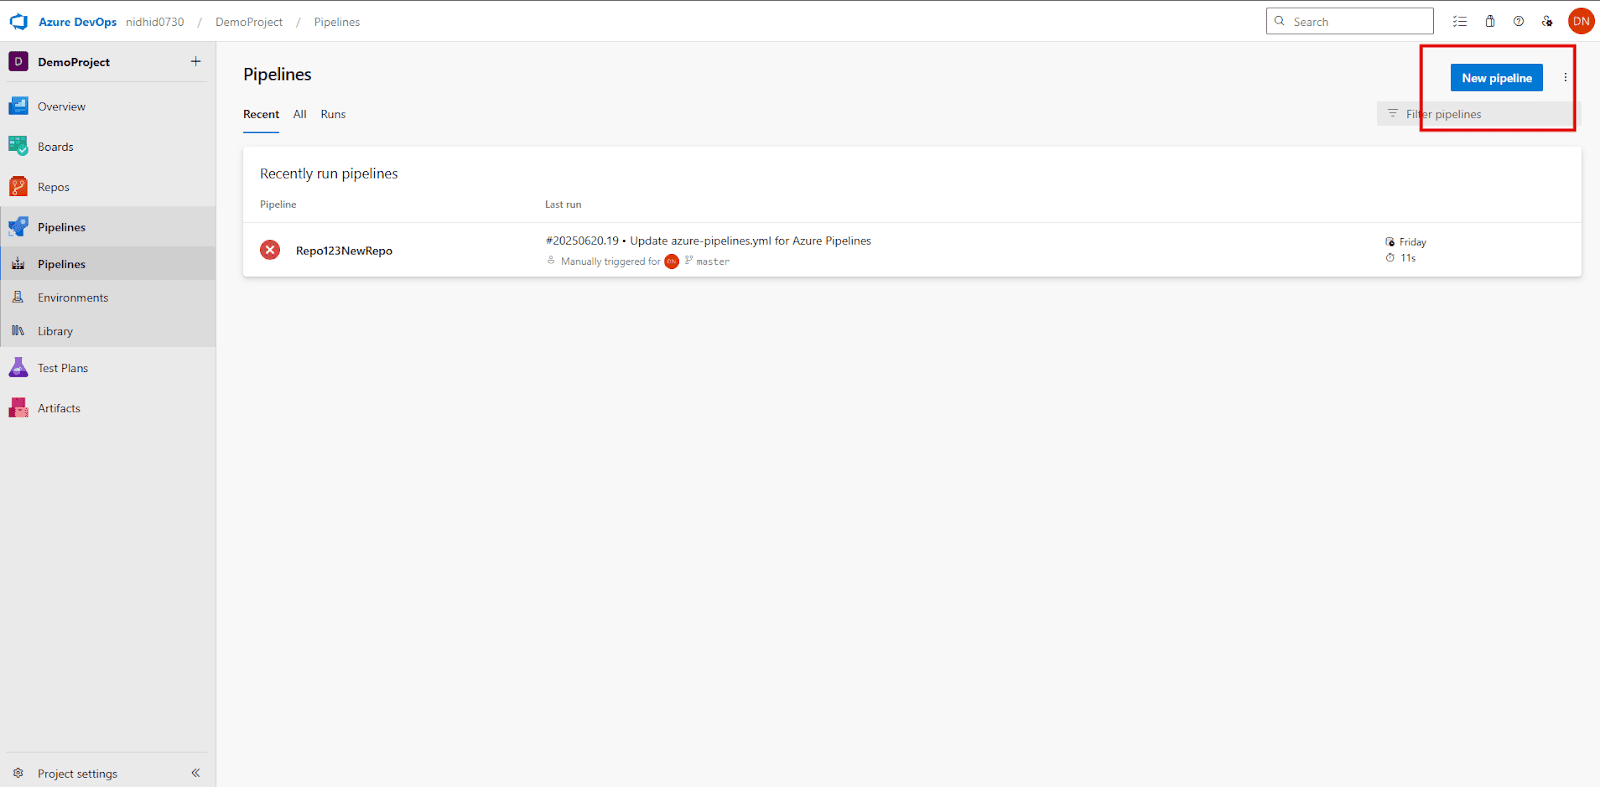
- Start Pipeline Creation: In the left-hand navigation pane, click on Pipelines, then select Create Pipeline.
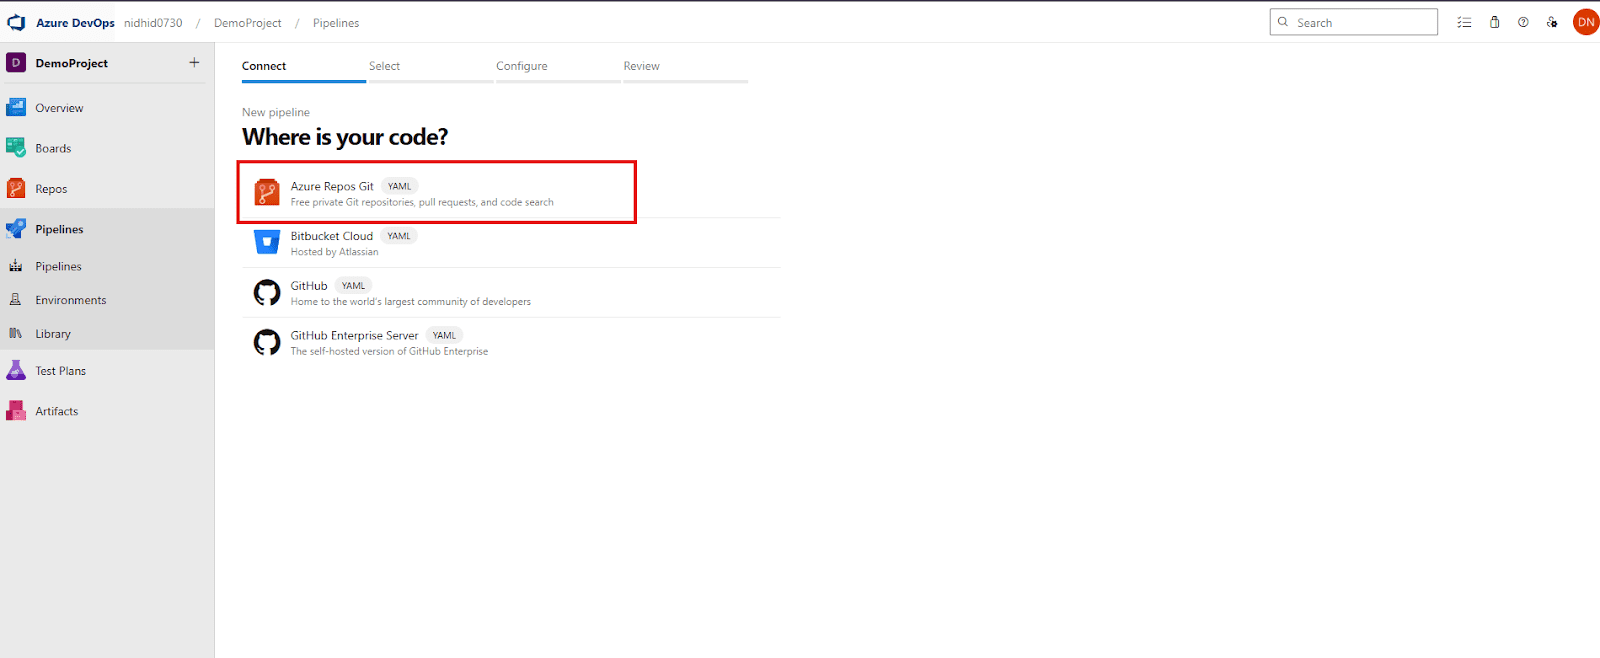
- Select Code Location: You’ll be prompted to choose where your source code resides. For this guide, select Azure Repos Git.
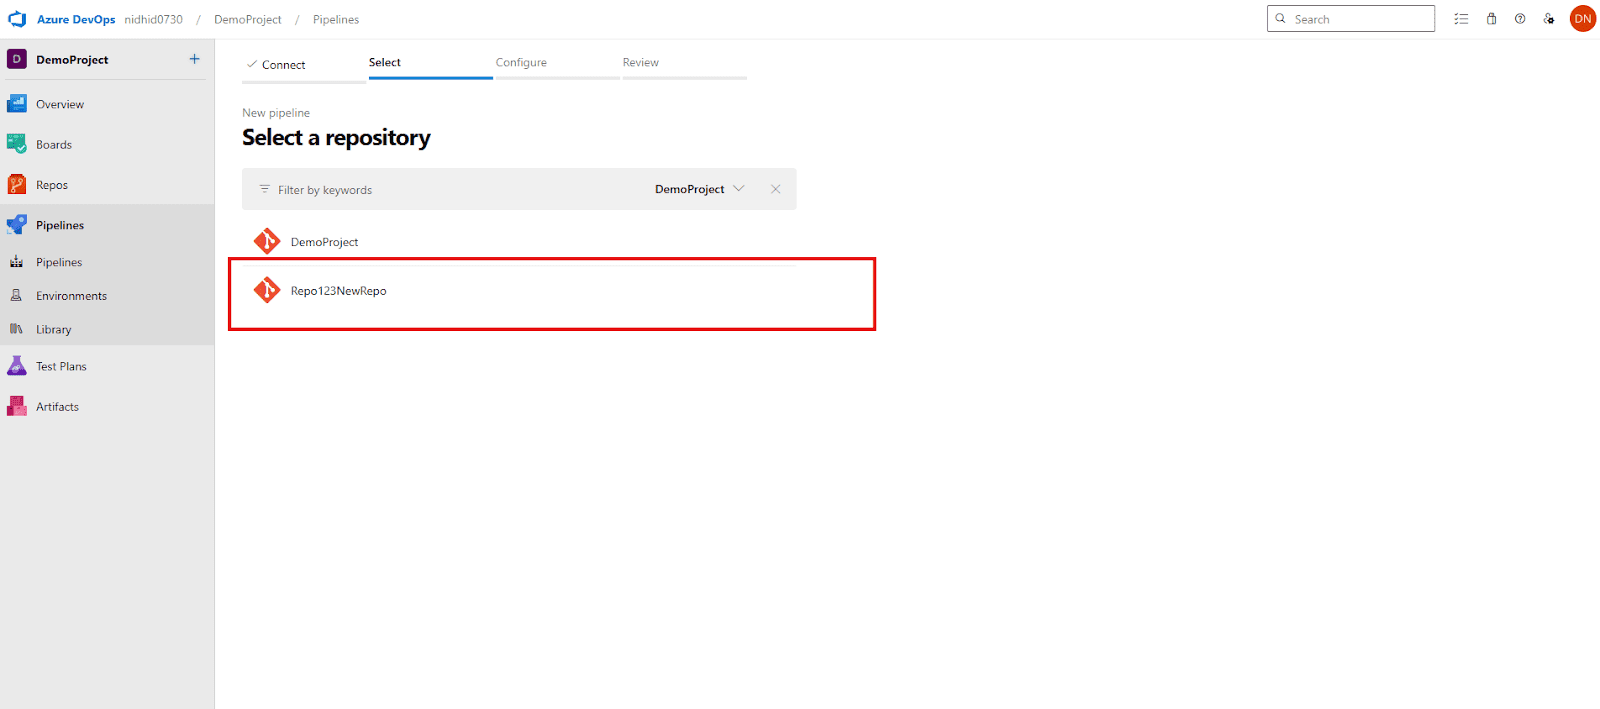
- Choose Repository: From the list of repositories, select the one containing your Selenium test project (e.g.,Repo123NewRepo).
- Configure Pipeline Type: When asked how you want to configure your pipeline, opt for YAML. This allows you to define your pipeline as code, offering greater flexibility and version control.
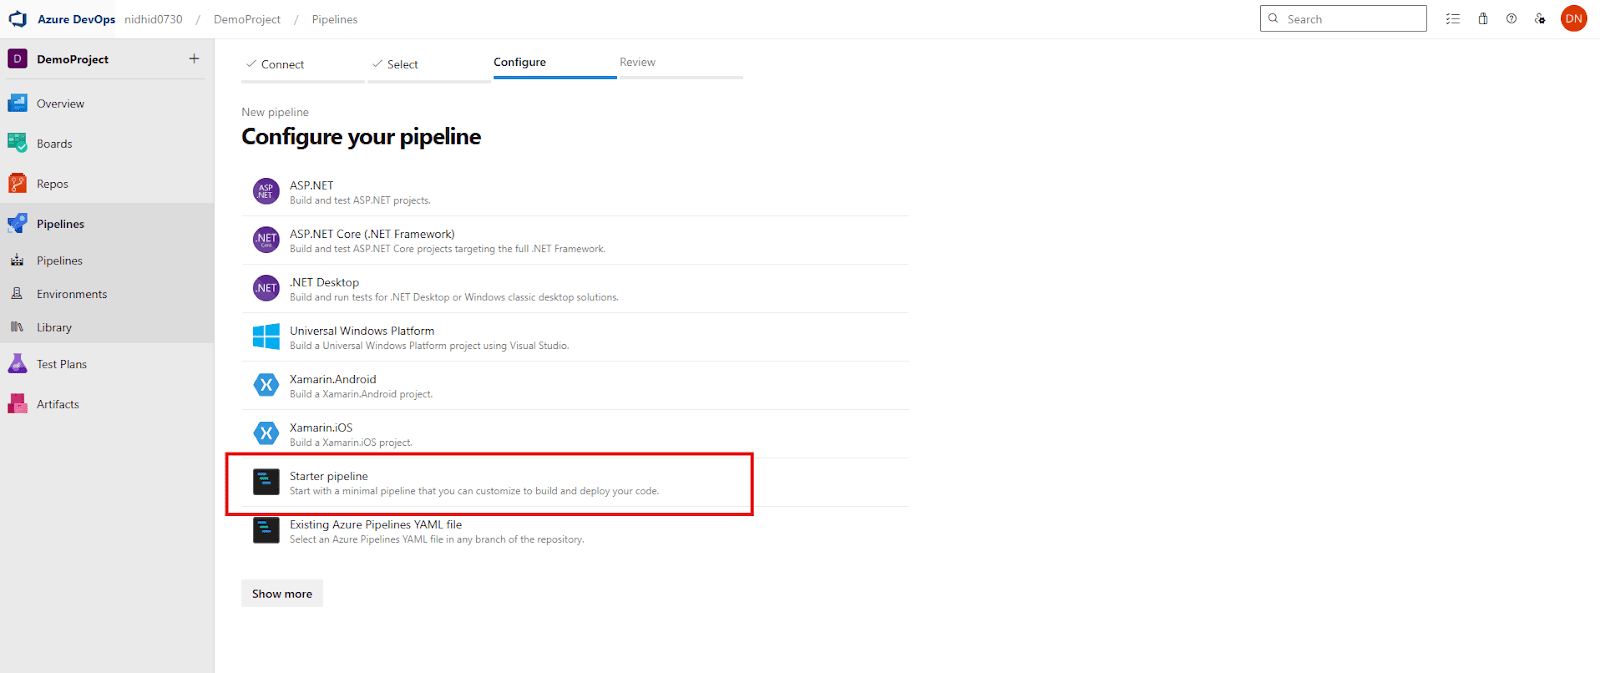
- Review Initial YAML: Azure DevOps will present a basic azure-pipelines.yml file in an editor for you to review and modify. This file is automatically placed in the root of your repository. You will then proceed to customize this file in the next step.
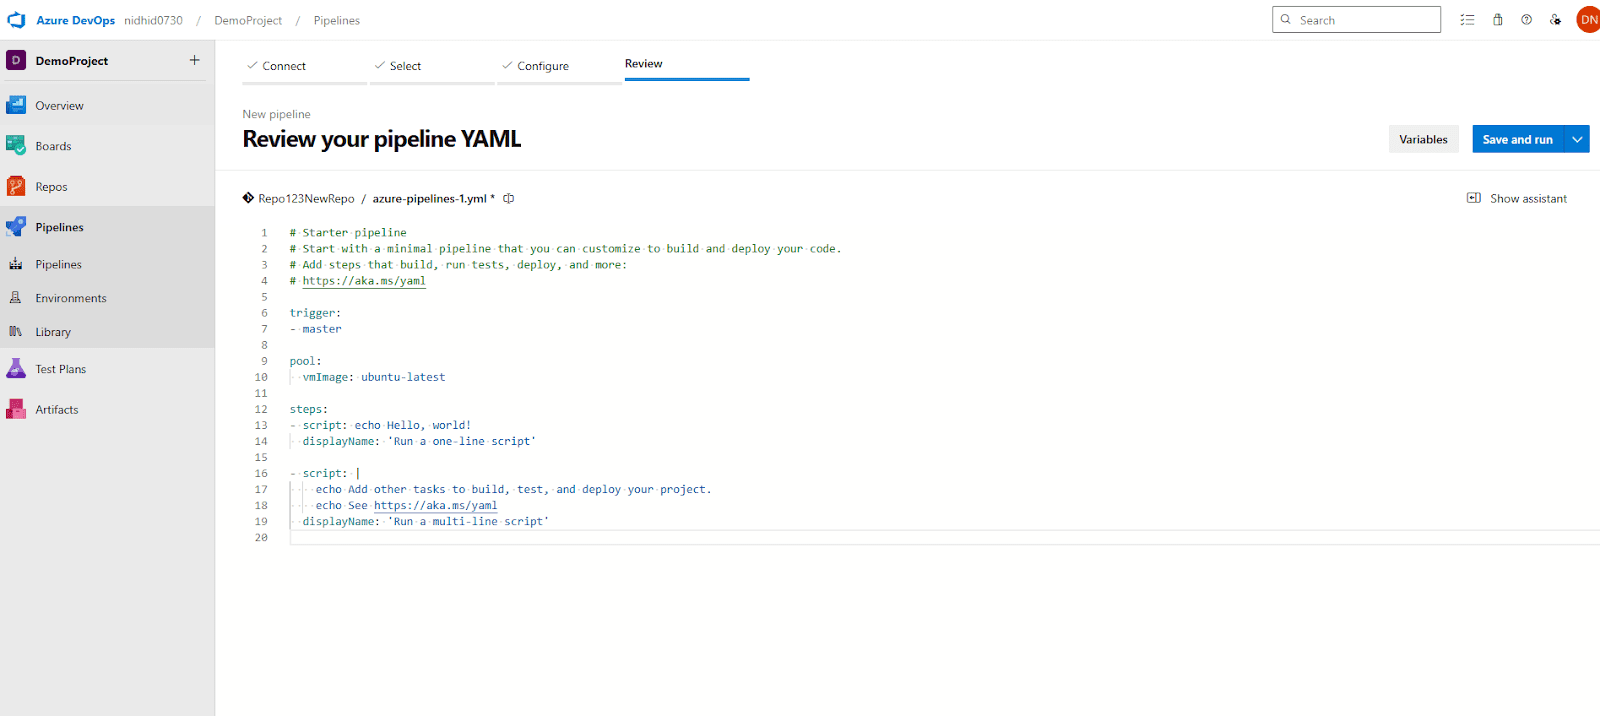
Step 2: Write Your azure-pipelines.yml File
The azure-pipelines.yml file is the script that dictates every action your pipeline will perform. It’s written in YAML, a human-readable data serialization format.
Here’s a basic yet powerful YAML pipeline that instructs Azure DevOps to build your .NET project and execute your Selenium tests:
- This ‘trigger’ section defines when the pipeline should automatically run.
- Here, it will trigger a new build whenever changes are pushed to the ‘master’ branch.
trigger:

  branches:

    include:

- master # Change 'master' to your new branch name (e.g., 'new_test_branch')- ‘pool’ specifies the agent on which your pipeline jobs will run.
- ‘windows-latest’ uses a Microsoft-hosted agent with the latest Windows Server version,
- pre-installed with common tools, including .NET SDK and Chrome.
pool:

vmImage: 'windows-latest'- ‘Variables’ allow you to define reusable values.
- ‘buildConfiguration’ is set to ‘Release’ for optimized builds.
variables:

buildConfiguration: 'Release'- ‘steps’ define the sequence of tasks that the pipeline will execute.
- steps:
- Task 1: UseDotNet – Ensures the correct .NET SDK version is available on the agent.
- This is crucial for building your C# project.
- task: UseDotNet@2

  inputs:

    packageType: 'sdk'

version: '6.0.x' # Specify the .NET SDK version compatible with your project (e.g., 6.0.x, 8.0.x)- Task 2: NuGetToolInstaller – Installs the NuGet command-line tools on the agent.
- NuGet is essential for managing your project’s dependencies.
- task: NuGetToolInstaller@1- Task 3: NuGetCommand – Restores all NuGet packages required by your solution.
- This downloads all the Selenium, NUnit, and other dependencies.
- task: NuGetCommand@2

  inputs:

    command: 'restore'

restoreSolution: '**/*.sln' # Looks for any .sln file in the repository to restore packages for.- Task 4: VSBuild (or DotNetCoreCLI for .NET Core/.NET 5+) – Builds your C# solution.
- This compiles your code into executable assemblies (.dll files).
- For modern .NET projects, ‘DotNetCoreCLI@2’ with command ‘build’ is also a great alternative.
- task: VSBuild@1

  inputs:

    solution: '**/*.sln' # Path to your solution file.

msbuildArgs: '/p:Configuration=$(buildConfiguration)' # Builds in 'Release' configuration.- Task 5: VSTest – Discovers and runs your automated tests.
- This task executes the tests found in your compiled test assemblies.
- It’s configured to search for test DLLs and exclude test adapter DLLs.
- task: VSTest@2

  inputs:

    testSelector: 'testAssemblies' # Specifies to run tests from compiled assemblies.

    testAssemblyVer2: |

      **\*test*.dll         # Includes any DLL file with 'test' in its name.

      !**\*TestAdapter.dll  # Excludes test adapter DLLs themselves.

      !**\obj\** # Excludes files within 'obj' directories.
The VSTest task automatically publishes results to Azure DevOps’s ‘Tests’ tab.
Explanation of Each Step
Let’s demystify each component of this YAML pipeline, understanding its role in the overall CI/CD process:
Tips for Beginners
- Save this file as azure-pipelines.yml in the root of your repo.
- Make sure your .csproj and .sln files are properly committed.
- Tests should use Assert methods to pass/fail automatically.
- Use [TestCategory(“UI”)] in tests if you want to filter only Selenium tests later.
Summary
- You created your first Azure Pipeline using YAML.
- Wrote a step-by-step script to build and test your Selenium C# project.
- Azure DevOps will now automatically run your tests whenever someone pushes new code!
Running Tests in Azure Pipelines
Once your Azure Pipeline is meticulously configured with the correct YAML, the true power of automation begins to unfold. Your automated Selenium tests are now primed and ready to execute as an integral part of your Continuous Integration/Continuous Delivery (CI/CD) workflow. This section will guide you through the various ways to initiate these automated test runs and, crucially, how to effectively interpret the logs and results to understand the quality of your latest code changes.
How to Trigger the Pipeline
Azure Pipelines offers a versatile array of methods to trigger your builds and tests, allowing you to tailor the pipeline’s initiation to perfectly match your development workflow and testing strategy.
- Manual Trigger:
- This is often the go-to method when you’re initially setting up your pipeline and want to quickly verify that all steps are correctly configured and functional. It’s also useful for ad-hoc re-runs or specific validations.
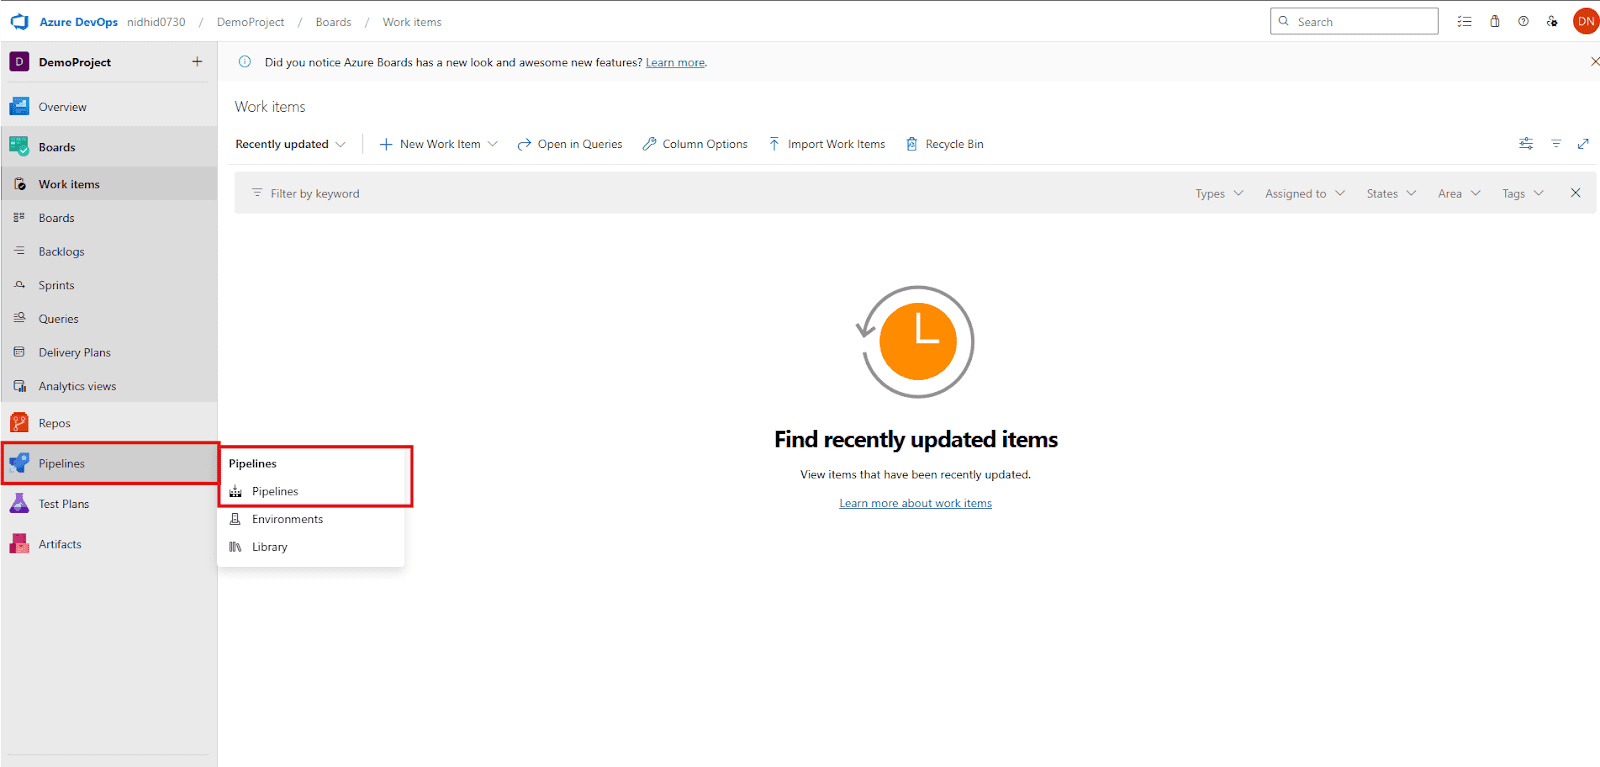
- How to: Navigate to your project within the Azure DevOps portal. From the left-hand menu, go to Pipelines > Pipelines. Select your specific pipeline from the displayed list. You’ll then see a prominent “Run pipeline” button.
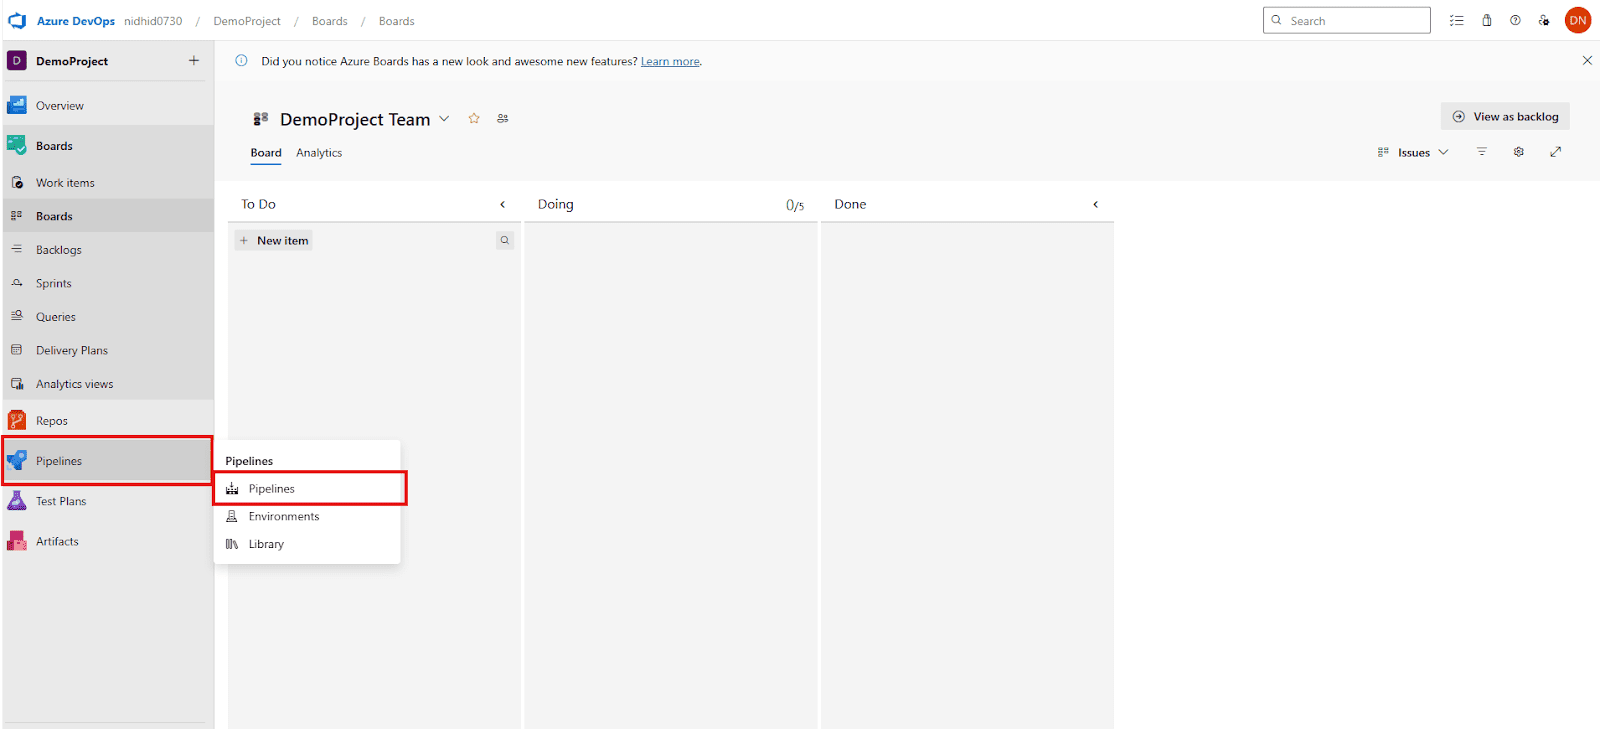
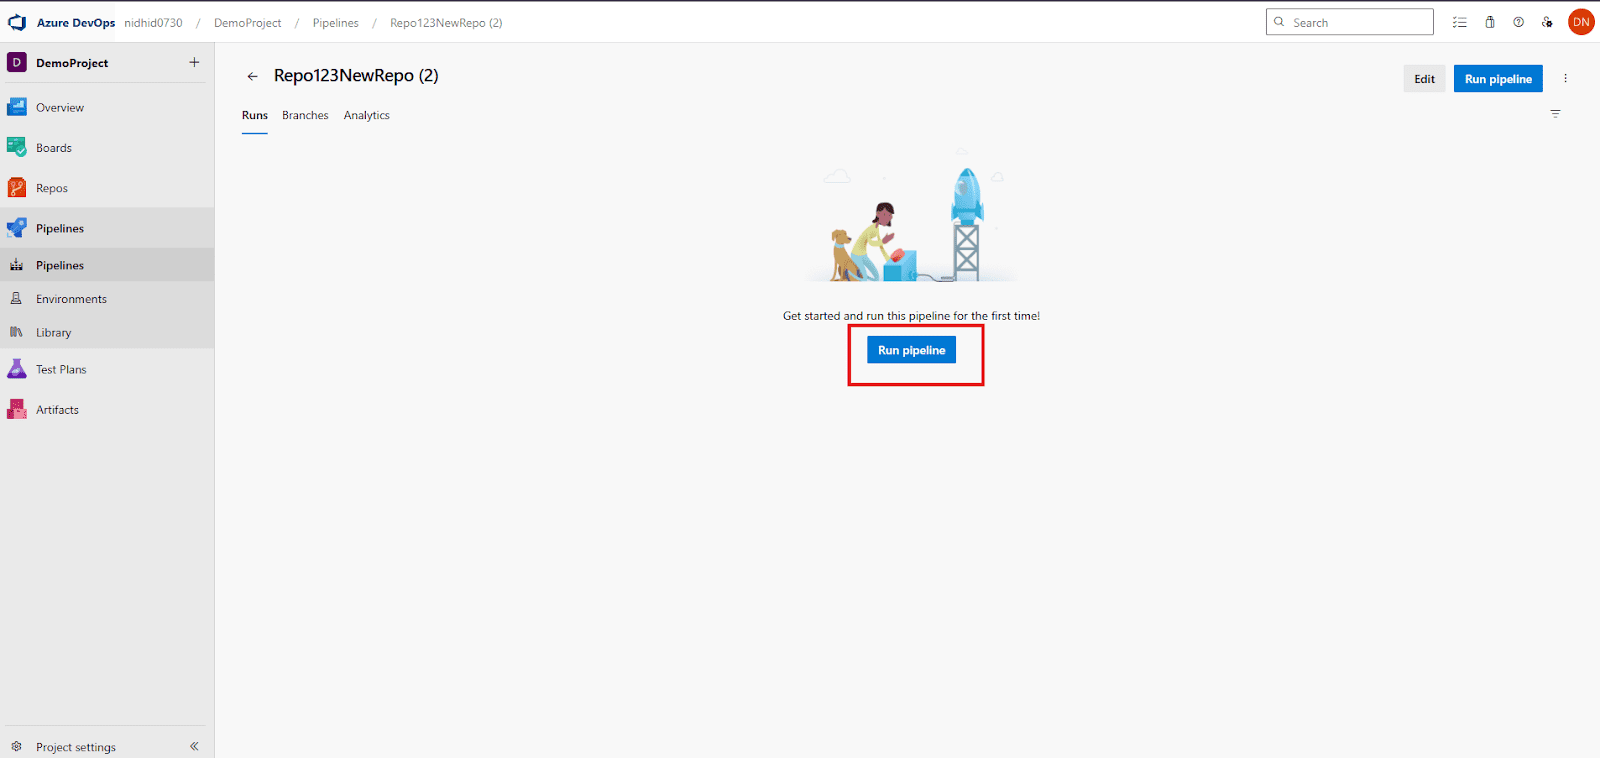
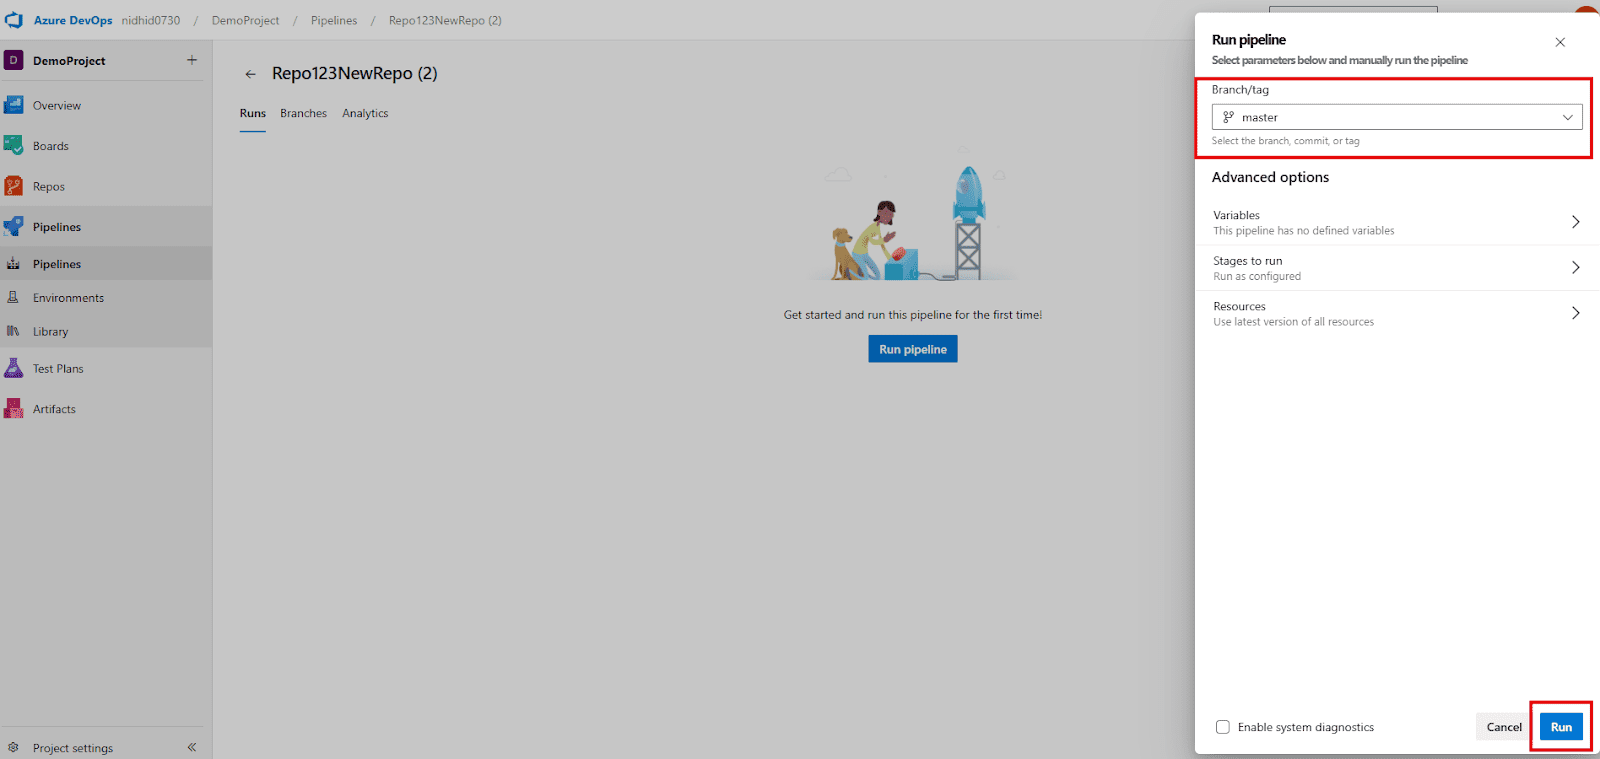
- Upon clicking, you’ll typically be presented with options to select the target branch (e.g., main or a particular feature branch) and possibly input any runtime parameters you might have defined in your YAML file. Confirm your choices and click “Run”.
- Example Use Case: You’ve just committed a new Selenium test, and you want to manually run the pipeline to ensure it integrates and passes as expected before pushing further changes.
- Continuous Integration (CI) Trigger (Automated on Code Push):
- This is arguably the most fundamental and powerful trigger in a CI/CD pipeline. It embodies the core principle of Continuous Integration.
- How to: By including a trigger section directly in your pipeline’s YAML file (as detailed in Section 5), the pipeline is automatically instructed to start a new run every single time new code changes are pushed to the specified branches in your Azure Repo.
- YAML Example:
- This is arguably the most fundamental and powerful trigger in a CI/CD pipeline. It embodies the core principle of Continuous Integration.
trigger:
- main # This pipeline will run on every push to the 'main' branch

- features/* # Or any branch matching 'features/...' for feature development- Example Use Case: A developer commits and pushes a new feature or a bug fix. Immediately, the CI pipeline automatically builds the updated code, runs all configured Selenium UI tests, and provides rapid feedback on the success or failure of the changes, catching regressions instantly.
- Scheduled Trigger:
- For scenarios requiring periodic validation or nightly checks, Azure Pipelines allows you to configure your pipelines to run at specific, predefined times, irrespective of whether any code changes have occurred.
- How to: This type of trigger is defined using the schedules section within your pipeline’s YAML. You use cron syntax to specify the schedule.
- For scenarios requiring periodic validation or nightly checks, Azure Pipelines allows you to configure your pipelines to run at specific, predefined times, irrespective of whether any code changes have occurred.
YAML Example:
Schedules:
- cron: "0 0 * * *"  # Runs every day at midnight UTC
  displayName: Daily Midnight Regression Run
 Branches:
  Include:
  - main # Only run this schedule for the 'main' branch
always: true # always run, even if no changes have occurred since the last run- Example Use Case: Running a full suite of lengthy end-to-end (E2E) Selenium tests overnight when system load is low, or generating daily reports based on the complete test results.
- Pull Request (PR) Trigger:
- The Pull Request (PR) trigger is a vital quality gate in collaborative development workflows.
- How to: When a developer creates a Pull Request to propose merging code from one branch (e.g., a feature branch) into a more stable branch (e.g., main), the pipeline can be configured to automatically execute a set of tests against the merged code.
- YAML Example:
- The Pull Request (PR) trigger is a vital quality gate in collaborative development workflows.
pr:
- main
# This pipeline will run on Pull Requests targeting the 'main' branch
Example Use Case: Before a new feature branch is merged into the main development branch, the PR pipeline automatically executes C# unit tests and a critical subset of Selenium integration tests to ensure the proposed changes do not introduce any regressions or break existing functionality. The PR cannot be completed until these tests pass, enforcing code quality.
Viewing Logs and Results
Understanding the outcome of your pipeline runs is paramount to diagnosing issues and ensuring software quality. Azure Pipelines provides a rich and comprehensive interface for reviewing every detail of your pipeline’s execution, from real-time logs to granular test results.
- Accessing Pipeline Runs:
- After your pipeline has been triggered (manually or automatically), you’ll see a new “run” entry appear in the Pipelines view. Each run is uniquely identified by an ID.
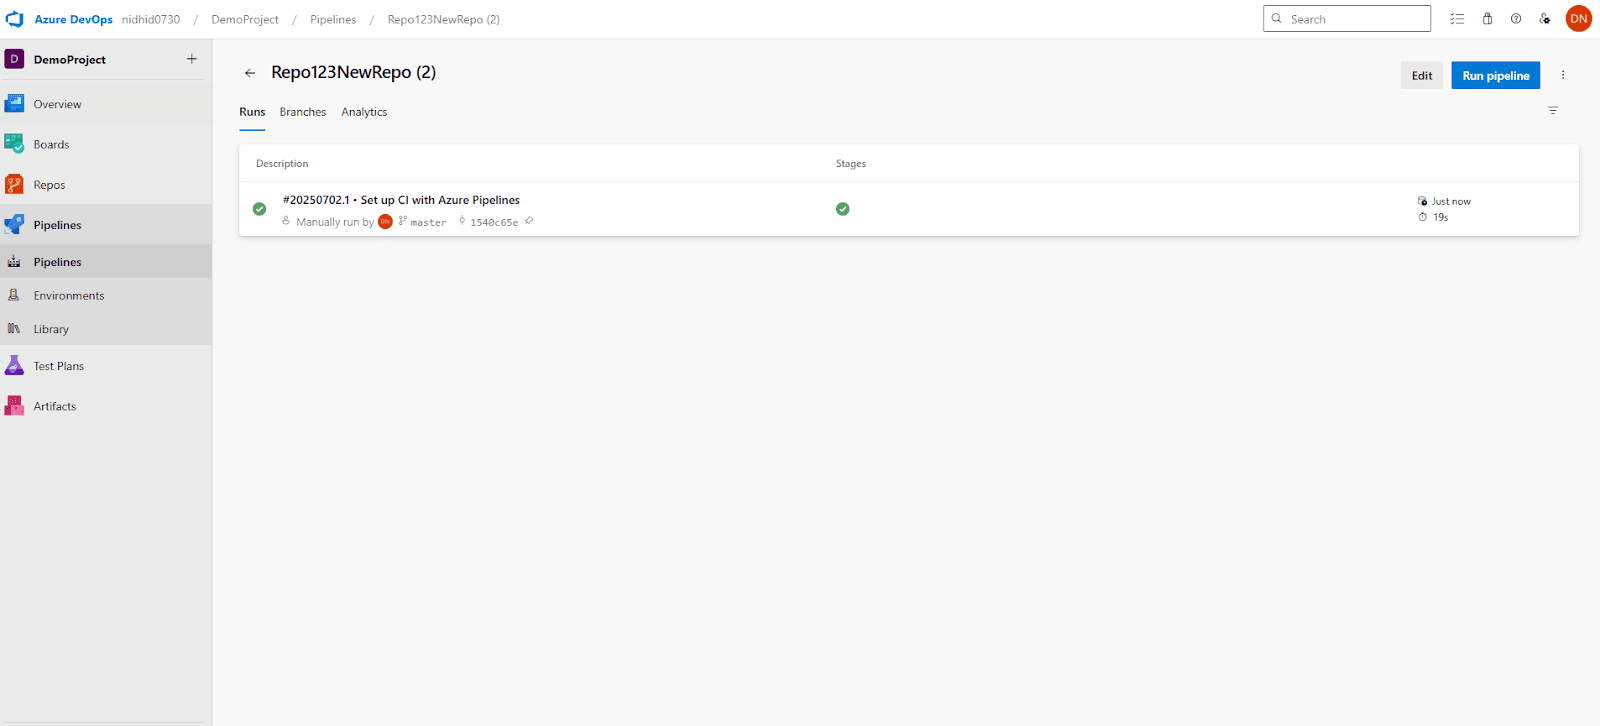
- Click on the specific run ID to delve into its detailed summary. This page provides a high-level overview of all the jobs (concurrent or sequential sets of steps) within that particular run, along with their current statuses (succeeded, failed, canceled, skipped).
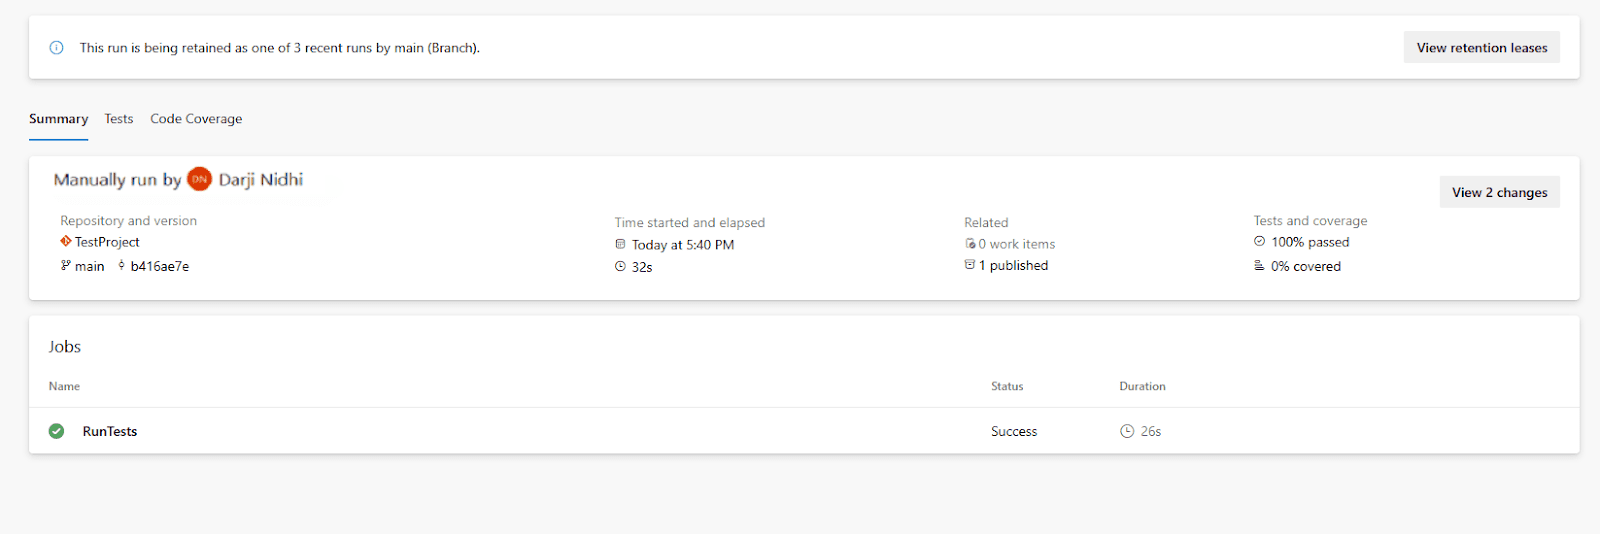
- Reviewing Job Details:
- From the run summary, click on a specific “job” (e.g., Build and Test, which often contains your build and test steps) to watch its individual steps execute in real-time. This view provides a console-like output for each task.
- Every step within a job (e.g., Restore NuGet packages, Build solution, Run tests) will stream its output logs directly into this interface. This is invaluable for tracking progress and pinpointing issues.
- Error Identification: If any step fails, the corresponding log section will often vividly highlight the error message in red, making it straightforward to pinpoint the exact point of failure. For Selenium test failures specifically, you should look for detailed stack traces, assertion failures, or exceptions related to browser interactions.
- Analyzing Test Results:
- Once the VSTest or DotNetCoreCLI test command step within your pipeline completes its execution, navigate back to the primary pipeline run summary page.
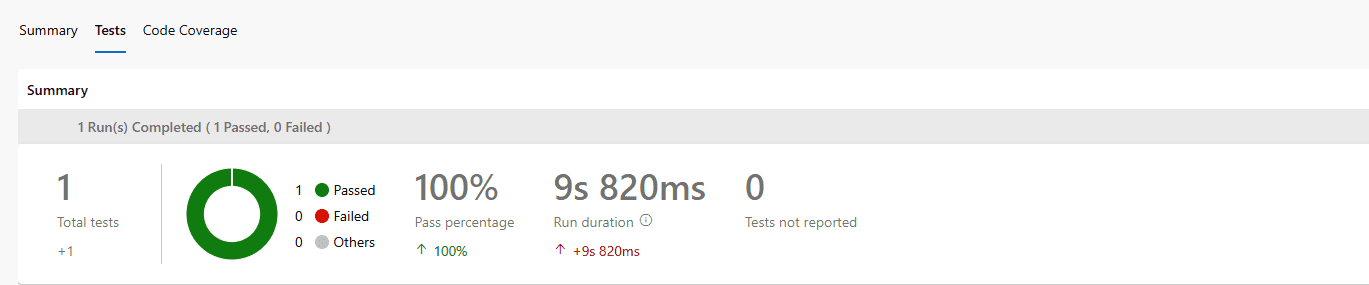
- You will find a dedicated “Tests” tab. Click on this tab to open the comprehensive test results summary.
- This tab offers a detailed breakdown of your automated test execution:
- Summary: Provides aggregated metrics, including the total number of tests run, how many passed, how many failed, and any that were skipped.
- Result Filter: Allows you to quickly filter tests by their outcome (e.g., only show “Pass”, “Fail”, or “Other”), by their execution duration (to identify slow tests), or by the test class they belong to.
- Individual Test Results: The most powerful feature here is the ability to click on any failed test to access its full, granular details. This typically includes:
- Error Message: The specific exception message thrown by your test (e.g., AssertionException, NoSuchElementException).
- Stack Trace: A detailed call stack that helps you trace the execution path back to the precise line of code in your C# test where the failure occurred.
- Attachments: Crucially, if your test framework (such as NUnit or xUnit.net) or your custom test code is configured to generate artifacts like screenshots on failure, these will be attached here. A screenshot taken at the exact moment of failure provides invaluable visual context for debugging UI issues, showing the state of the web page at the time the error occurred.
- Example: If a Selenium test fails, the “Tests” tab will show “Failed: 1″. Clicking on it reveals the error: OpenQA.Selenium.NoSuchElementException: No such element: [id=”username”], along with the screenshot taken at the time of failure, indicating a problem with the login page.
- Error Message: The specific exception message thrown by your test (e.g., AssertionException, NoSuchElementException).
- Summary: Provides aggregated metrics, including the total number of tests run, how many passed, how many failed, and any that were skipped.
By skillfully triggering your pipelines and diligently reviewing the rich output of logs and comprehensive test results, you gain unparalleled visibility into the health and quality of your codebase. This proactive approach makes Continuous Quality not just a concept, but a tangible reality within your software development lifecycle.
Using Headless Browsers for CI/CD
When the powerful Selenium automated tests you’ve developed are run within a CI/CD pipeline like Azure Pipelines, they are typically executed on a build agent. This agent is often a server environment that might not have a graphical user interface (GUI) or a physical monitor connected. In such scenarios, trying to launch a visible browser instance would either fail or consume unnecessary resources. This is precisely where headless browsers become an absolutely indispensable tool.
Why Headless Mode is Useful
A headless browser is essentially a web browser that operates entirely in the background, completely devoid of a visible user interface. It performs all the actions of a regular browser – navigating to URLs, clicking elements, filling forms, executing JavaScript – but without the overhead of rendering graphics to a screen. This fundamental difference unlocks significant advantages, particularly for CI/CD integration:
Here’s why headless mode is particularly beneficial for CI/CD integration:
- Performance & Speed:
- Since a headless browser doesn’t need to dedicate resources to rendering pixels, drawing UI elements, or displaying content visually, it consumes significantly fewer CPU cycles and memory.
- This translates directly into substantially faster test execution times. In a CI/CD environment where rapid feedback is paramount, shaving off minutes (or even seconds) from a test suite run can dramatically improve development velocity.
- Example: A comprehensive suite of 100 Selenium UI tests that might take 15-20 minutes to complete with a visible browser could potentially finish in just 10 minutes (or even less) when run in optimized headless mode.
- Since a headless browser doesn’t need to dedicate resources to rendering pixels, drawing UI elements, or displaying content visually, it consumes significantly fewer CPU cycles and memory.
- Resource Efficiency:
- Build agents, whether Microsoft-hosted or self-hosted, often operate with finite CPU and memory resources. Running browsers in headless mode drastically reduces their resource footprint, meaning you can potentially execute more tests concurrently on the same agent or even utilize smaller, less powerful (and thus more cost-effective) build agents.
- Build agents, whether Microsoft-hosted or self-hosted, often operate with finite CPU and memory resources. Running browsers in headless mode drastically reduces their resource footprint, meaning you can potentially execute more tests concurrently on the same agent or even utilize smaller, less powerful (and thus more cost-effective) build agents.
- No GUI Required:
- A significant proportion of CI/CD build servers (including many Azure Pipeline agents) are provisioned and configured without a graphical desktop environment. Headless browsers are specifically designed to operate perfectly in such CLI-only (Command Line Interface) environments, eliminating compatibility issues.
- Example: You do not need to install a full Windows desktop operating system or set up an X server (for graphical output) on your Linux-based build agent just to run automated Chrome browser tests.
- A significant proportion of CI/CD build servers (including many Azure Pipeline agents) are provisioned and configured without a graphical desktop environment. Headless browsers are specifically designed to operate perfectly in such CLI-only (Command Line Interface) environments, eliminating compatibility issues.
- Stability:
- By removing the graphical user interface component, headless browser execution can sometimes lead to more consistent and stable test runs. This is because there are fewer external variables, such as display drivers, screen resolutions, or pop-up windows, to potentially interfere with the browser’s automated operation.
- By removing the graphical user interface component, headless browser execution can sometimes lead to more consistent and stable test runs. This is because there are fewer external variables, such as display drivers, screen resolutions, or pop-up windows, to potentially interfere with the browser’s automated operation.
- Parallel Execution:
- Managing multiple visible browser windows during parallel test execution can be cumbersome and resource-intensive. Headless browsers simplify parallel test execution significantly, as you don’t have to contend with multiple visual instances, making the process cleaner and more efficient.
How to Configure ChromeDriver Headless
For your Selenium tests written in C#, ChromeDriver (the WebDriver implementation for Google Chrome) is a frequently used option. Configuring it to run in headless mode is a straightforward process that involves adding a specific argument to its launch options:
- Instantiate ChromeOptions: You first need to create an instance of the ChromeOptions class. This class allows you to customize various aspects of the Chrome browser’s behavior, including headless mode, startup arguments, and user profiles.
- Add the –headless Argument: To enable headless mode, you must add the –headless argument to your ChromeOptions instance using the AddArgument() method.
- Pass Options to ChromeDriver: Finally, when you instantiate your ChromeDriver (the actual browser driver), you pass the configured ChromeOptions object to its constructor.
using OpenQA.Selenium;
using OpenQA.Selenium.Chrome;
using NUnit.Framework; // Or Xunit.Framework for other frameworks
using WebDriverManager;
using WebDriverManager.DriverConfigs.Impl;

[TestFixture] // Or [Collection] for XUnit, marks a class containing tests
public class HeadlessBrowserTests
{
    private IWebDriver _driver; // Using IWebDriver for more flexibility

    [SetUp]
    public void Setup()
    {
        // 1. Set up ChromeDriver using WebDriverManager (highly recommended)
        // This ensures the correct ChromeDriver version is downloaded and managed automatically.
        new DriverManager().SetUpDriver(new ChromeConfig());

        // 2. Create ChromeOptions object to configure the browser.
        ChromeOptions options = new ChromeOptions();

        // 3. Add the --headless argument: This is the core line for headless execution.
        options.AddArgument("--headless");

        // Optional: Add more arguments for improved headless stability and logging in CI/CD environments.
        // These arguments address common issues found when running Chrome headless on servers.
        options.AddArgument("--disable-gpu");          // Recommended for Windows agents to avoid GPU-related issues.
        options.AddArgument("--no-sandbox");          // Crucial for Linux agents, as root processes cannot create sandboxes.
        options.AddArgument("--window-size=1920,1080"); // Set a consistent, large window size for stable element visibility.
        options.AddArgument("--disable-dev-shm-usage"); // Recommended for Docker/Linux environments to avoid shared memory issues.

        // 4. Initialize ChromeDriver with the configured options.
        // WebDriverManager handles the path to ChromeDriver.exe. If not using WebDriverManager,
        // you would manually specify the path: new ChromeDriver(@"C:\Path\To\Driver\chromedriver.exe", options);
        _driver = new ChromeDriver(options);

        // Optional: Add an implicit wait. This tells Selenium to wait for elements
        // to be found for a certain period before throwing a NoSuchElementException.
        _driver.Manage().Timeouts().ImplicitWait = TimeSpan.FromSeconds(10);
    }

    [Test]
    public void SearchGoogleHeadless()
    {
        _driver.Navigate().GoToUrl("https://www.google.com");
        IWebElement searchBox = _driver.FindElement(By.Name("q"));
        searchBox.SendKeys("Selenium Headless C#");
        searchBox.Submit();

        // Assert that the page title contains the expected text after the search.
        Assert.That(_driver.Title, Does.Contain("Selenium Headless C#"), "Page title does not contain the expected search query.");
    }

    [TearDown]
    public void Teardown()
    {
        // Ensure the driver is not null before quitting to prevent NullReferenceExceptions.
        if (_driver != null)
        {
            _driver.Quit();    // Closes the browser and all associated windows.
            _driver.Dispose(); // Disposes the driver instance, freeing up system resources.
        }
    }
}
By intelligently adopting headless browser execution for your Selenium automation, your tests become significantly leaner, execute with greater speed, and are inherently more compatible with the typically constrained and GUI-less environments of CI/CD pipelines. This powerful configuration is a key enabler for truly efficient and robust DevOps practices.
Tips for Better CI/CD Integration
Successfully integrating Selenium tests into Azure Pipelines is more than just getting your tests to run; it’s about optimizing the entire process for maximum efficiency and reliability. A well-thought-out test strategy and meticulous pipeline configuration can dramatically accelerate feedback loops, enhance test suite maintainability, and improve overall development efficiency.
Test Naming Conventions
Consistent and descriptive naming conventions are not merely aesthetic; they are a critical aspect of test automation for test suites, test classes, and individual test methods. They contribute immensely to the clarity, maintainability, and diagnostic capabilities of your automated test suite.
- Readability: Clear names allow any team member, at a glance, to quickly grasp the purpose and expected behavior of a test without needing to delve into its code.
- Maintainability: When a test fails or a feature changes, well-named tests make it significantly easier to locate the relevant test code for modification, debugging, or expansion.
- Reporting: In Azure Pipelines test reports, clear names simplify the identification of failed scenarios, helping stakeholders and developers quickly understand what broke.
- Filtering: Descriptive names enable you to precisely select and run specific subsets of tests via command-line arguments in your pipeline, which is invaluable for targeted testing (e.g., running only “smoke” tests).
Best Practices:
- Test Class Names: These should clearly indicate the specific feature, module, or area of the application being tested.
- Good: LoginTests.cs, ProductPageTests.cs, ShoppingCartFeatureTests.cs
- Bad: Tests1.cs, UITests.cs
- Test Method Names: This is where you describe the specific scenario being tested and its expected outcome. Employ a clear, expressive pattern like Given_When_Then or Should_Do_Something_When_Something_Happens for maximum clarity.
- Good: Login_WithValidCredentials_ShouldRedirectToDashboard(), AddItem_ToEmptyCart_ShouldDisplayOneItem(), Checkout_WithInvalidCreditCard_ShouldDisplayErrorMessage()
- Bad: TestLogin(), VerifyCart(), BugfixTest()
- Grouping/Categories (e.g., NUnit Categories, XUnit Traits): Beyond naming, leverage attributes provided by your test framework to categorize tests. This is incredibly powerful for organizing and running subsets of tests.
- Usage: Apply attributes like [Category(“Smoke”)], [Category(“Regression”)], [Category(“E2E”)] (for NUnit) or [Trait(“Category”, “Smoke”)] (for xUnit.net) to your test classes or methods.
- Benefit: This allows your Azure Pipelines VSTest task to execute only tests belonging to specific categories using filters (e.g., dotnet test –filter Category=Smoke in your YAML). This is crucial for creating efficient test runs at different stages of your pipeline.
Separating Unit and UI Tests
It is a widely accepted and highly beneficial software testing best practice to maintain a clear and distinct separation between unit tests and UI (User Interface) tests, which typically encompass your Selenium-driven End-to-End (E2E) tests. This separation is fundamental for an optimized and efficient CI/CD pipeline.
Why separate them?
- Execution Speed: Unit tests are fast, isolated, and run in milliseconds. UI tests are slower, involve a browser, and interact with a deployed application. Mixing them in one project can lead to slow feedback cycles.
- Feedback Loop: You want the fastest possible feedback on code changes. Unit tests provide this immediately. UI tests provide broader validation later in the pipeline.
- Maintainability: Different types of tests have different dependencies and failure modes. Separation makes maintenance easier.
- Pipeline Optimization: Allows you to run unit tests frequently (on every commit) and UI tests less frequently (on every successful build or once a day).
How to Separate:
- Separate Projects within Your Solution: The most robust and recommended approach is to create distinct C# projects within your Visual Studio solution.
- YourApp.UnitTests.csproj: This project would contain all your fast-running unit tests, often testing business logic or individual components.
- YourApp.UITests.csproj: This separate project would exclusively house your Selenium UI tests and their related Page Objects, utilities, and configurations. This project would have its own set of NuGet dependencies (e.g., Selenium.WebDriver, WebDriverManager).
- Separate Folders/Namespaces (within a single project – less ideal but possible): If, for very small projects, you opt to keep all tests in a single project, enforce strict logical separation using distinct folder structures and namespaces.
- YourApp.Tests.Unit namespace and folder for unit tests.
- YourApp.Tests.UI namespace and folder for Selenium UI tests.
- Note: Even with this, you might still run all tests together unless you use test categories or filters very diligently in your pipeline.
When to Run What (Test Strategy in CI/CD)
This is perhaps the most crucial aspect of designing an effective CI/CD testing strategy. The core objective is to obtain the most valuable and relevant feedback as quickly as possible, all while intelligently managing computational resources and avoiding unnecessary delays. This involves creating a “test pyramid” or “test funnel” where faster, more numerous tests run earlier and more frequently.
- On Every Commit/Push to Feature Branch (Fast Feedback Loop):
- Unit Tests: These are absolutely essential and should be the very first line of defense. They verify individual code components in isolation, providing immediate feedback on local changes. Run all unit tests here.
- Static Code Analysis: Integrate tools like SonarQube or leverage built-in Roslyn analyzers. These tools analyze your code for potential bugs, security vulnerabilities, and adherence to coding standards without executing the code.
- Build Verification Tests (BVTs): A very small, highly critical subset of your UI tests (e.g., verifying the application loads, login page is accessible, basic navigation works). These are quick checks to ensure the application is fundamentally deployable and functional.
- Purpose: To provide rapid, near-instantaneous feedback to the developer on their latest code changes, allowing them to fix issues immediately.
- On Every Pull Request (PR) to Main/Develop Branch (Quality Gate):
- All Unit Tests: Rerun the complete suite of unit tests to confirm that the changes proposed in the PR do not introduce any regressions to the core logic.
- Integration Tests: Execute tests that verify interactions between different components, services, or layers of your application. These are still relatively fast but cover broader system parts than unit tests.
- Smoke Tests/Critical Path UI Tests: Run a focused, small set of Selenium End-to-End (E2E) tests that cover the absolute most critical user flows (e.g., core business transactions). These act as a quick health check for the integrated application.
- Purpose: To serve as a crucial quality gate, preventing faulty or regressive code from being merged into stable development branches (main, develop), thereby protecting the integrity of the shared codebase.
- On Successful Build to Main/Develop Branch (Comprehensive Validation):
- Full Regression UI Test Suite: Once code has been merged and the CI pipeline (including PR checks) passes, trigger a more comprehensive run of all your Selenium UI tests. This suite will naturally take longer but provides a much deeper level of confidence in the application’s overall functionality and user experience.
- Lightweight Performance Tests: If applicable, run automated tests that check basic performance metrics (e.g., page load times) to detect significant performance degradations early.
- Automated Security Scans: Integrate tools for static or dynamic application security testing (SAST/DAST) to proactively identify common vulnerabilities.
- Purpose: To provide comprehensive confidence in the application’s quality before it is considered for deployment to higher-level environments like Staging or Production.
- Scheduled Nightly/Weekly Runs:
- Full End-to-End Regression Tests: For extremely large and long-running Selenium automation test suites, or those requiring extensive setup or data, these can be scheduled during off-peak hours. This might also include running tests on different browsers or device configurations that are not part of the quicker CI/CD loops.
- Data Integrity Checks: Tests designed to verify the consistency and integrity of data over time, especially relevant for data-intensive applications.
- Load/Stress Tests: More intensive performance testing to simulate high user traffic and assess application behavior under stress.
- Purpose: To catch subtle, long-running issues, detect intermittent failures, or perform computationally expensive tests without impacting the immediate development flow during working hours.
By meticulously planning and strategically implementing when and how to run your diverse types of tests, you can construct a CI/CD pipeline that not only delivers incredibly fast and reliable feedback but also ensures a thorough and multi-layered quality assurance process for your C# applications. This structured approach is the hallmark of mature DevOps practices.
Conclusion
You’ve successfully journeyed through the intricate yet immensely rewarding process of establishing a powerful and efficient CI/CD pipeline, seamlessly integrating your Selenium automated tests with Azure Pipelines using the robust C# programming language. This sophisticated setup is not just a technical configuration; it’s a fundamental cornerstone of modern software development, directly contributing to continuous quality assurance and dramatically faster, more reliable software delivery cycles.
What You’ve Achieved
Throughout the comprehensive steps detailed in this blog post, you’ve acquired invaluable practical knowledge and gained hands-on experience across several critical domains of automated testing and DevOps:
- Foundational Understanding: You now possess a clear understanding of what Selenium is as a web automation tool and how Azure Pipelines functions as a CI/CD orchestration engine. More importantly, you grasp the compelling, synergistic reasons for integrating them within a modern DevOps workflow to achieve continuous feedback and quality.
- Test Project Setup: You’ve meticulously learned how to create a structured and organized Selenium test project in C# from the ground up using Visual Studio. This includes the vital steps of installing necessary NuGet packages (like Selenium.WebDriver and WebDriverManager) and crafting a foundational, executable sample test case.
- Version Control Integration: You’ve mastered the crucial skill of pushing your C# code to Azure Repos, ensuring that your entire test automation suite is version-controlled, collaborative, and forms the definitive source of truth alongside your application’s source code.
- YAML Pipeline Creation: A significant achievement is your ability to construct an Azure Pipeline from scratch using the powerful YAML syntax. You’ve defined the precise steps for building your C# solution, restoring all external dependencies, and orchestrating the execution of your tests.
- Automated Test Execution: You are now empowered to initiate your pipelines with various triggers – manually for ad-hoc checks, automatically on code pushes (Continuous Integration), upon pull requests (as a quality gate), or on a predefined schedule. You can actively observe your Selenium tests running autonomously on a dedicated build agent.
- Results Analysis: Critically, you’ve learned how to proficiently navigate the Azure Pipelines UI to access and interpret detailed execution logs and comprehensive test results. This includes pinpointing error messages, analyzing stack traces, and leveraging potential test artifacts like automated screenshots for rapid debugging.
- Headless Browser Implementation: You’ve successfully configured ChromeDriver to execute tests in headless mode. This optimization is crucial for achieving superior test execution speed and ensuring compatibility with the constrained, GUI-less environments typical of CI/CD agents.
- Best Practices for Scale: Beyond just technical setup, you’ve gained invaluable insights into vital CI/CD testing best practices. This includes adopting robust test naming conventions, strategically separating different types of tests (unit vs. UI), and intelligently determining the optimal timing for running various test suites within your pipeline.
Benefits of This Setup
The seamless and powerful integration of Selenium with Azure Pipelines yields a profound multitude of advantages that directly and significantly contribute to superior software quality, accelerated development cycles, and increased team confidence:
- Early Defect Detection: Automated tests are executed with high frequency, ensuring that bugs are caught almost immediately after they are introduced into the codebase. Identifying defects early in the development cycle makes them significantly cheaper, faster, and easier to fix, embodying the core principle of Shift Left testing.
- Faster Feedback: Developers receive immediate and actionable feedback on the impact of their latest code changes. This rapid feedback loop allows for quick remediation of issues, preventing small problems from escalating into major roadblocks.
- Improved Code Quality: The consistent and automated execution of tests acts as a continuous quality assurance mechanism. This encourages developers to write more robust, maintainable, and thoroughly testable code from the outset.
- Reduced Manual Effort: Automating repetitive and time-consuming UI tests frees up your valuable QA testers. They can then dedicate their expertise to more complex, insightful, and exploratory testing activities that truly require human intuition and critical thinking.
- Consistent Test Environment: Tests are always run in a standardized, clean, and isolated environment provided by the pipeline agent. This eliminates the frustrating “works on my machine” syndrome and ensures test results are reliable and reproducible across different runs and different developers.
- Enhanced Confidence in Deployments: A “green” pipeline – indicating that all automated builds and tests have passed – provides a high degree of confidence that the new code is stable, functional, and ready for deployment to higher-level environments (like Staging or Production), significantly reducing release anxiety.
- Auditability and Traceability: Every test run, its detailed results, and the specific code changes it validated are meticulously logged and fully traceable within the Azure DevOps platform. This provides a clear audit trail for compliance, debugging, and continuous improvement.
What’s Next?
While the setup you’ve achieved is a remarkably powerful starting point, the world of test automation and CI/CD offers vast opportunities for further enhancement and optimization. To truly elevate your test automation framework and streamline your CI/CD pipeline, consider exploring the following advanced topics:
- Advanced Reporting and Dashboards: Move beyond basic test result summaries. Utilize Azure DevOps Dashboards to create custom, intuitive visualizations of test trends, defect counts, build health over time, and other key quality metrics. This helps in identifying patterns and areas for improvement.
- Parallel Test Execution: As your Selenium test suite grows, sequential execution can become a bottleneck. Configure your Azure Pipeline to run tests across multiple agents or jobs simultaneously. This can drastically reduce the overall execution time for large suites, providing faster feedback.
- Cross-Browser and Cross-Platform Testing: Expand the coverage of your Selenium tests to run on a wider array of browsers (Firefox, Microsoft Edge, Safari) and different operating systems (Linux, macOS). For extensive coverage and real-device testing, explore cloud-based testing platforms like BrowserStack or Sauce Labs, which seamlessly integrate with Azure Pipelines.
- Robust Test Data Management: Implement sophisticated strategies for creating, managing, and efficiently cleaning up test data. This is crucial for ensuring that your Selenium tests are truly isolated, reliable, and repeatable, preventing tests from impacting each other or requiring manual data resets.
- Integration with Test Management Tools: For larger organizations, consider linking your automated test results from Azure Pipelines to dedicated test management tools (e.g., Azure Test Plans, TestRail, Zephyr). This provides a single source of truth for all test cases (manual and automated), comprehensive reporting, and improved traceability from requirements to defects.
- Deployment Automation (Full CI/CD): Extend your Azure Pipeline beyond just building and testing. Configure it to automatically deploy your application to a designated test environment (e.g., Staging) upon successful test runs. This closes the loop for Continuous Delivery/Deployment, pushing validated code closer to production with minimal human intervention.
By committing to the continuous refinement of your CI/CD pipeline and your Selenium test suite, you are not merely automating tests; you are actively constructing a robust, resilient, and highly efficient software delivery factory that consistently produces high-quality software at an accelerated pace.
Bonus: Troubleshooting Common Issues
Even with the most meticulous setup and configuration, the world of CI/CD and test automation can present its unique set of challenges. When integrating Selenium tests with Azure Pipelines, encountering issues is part of the learning process. This bonus section provides a practical guide to common problems you might face and offers systematic solutions, empowering you to debug efficiently and keep your pipeline flowing smoothly.
Build Failures
Build failures occur when your pipeline successfully fetches the code but then encounters problems during the compilation or dependency resolution phases (typically the dotnet build or dotnet restore steps). These are often related to project setup or environment discrepancies.
- “Project file not found” or “Solution file not found”:
- Cause: The build or restore task in your YAML (e.g., dotnet build $(solution)) is unable to locate your .sln (solution) or .csproj (project) file within the agent’s workspace. This usually means the path specified in your YAML is incorrect or relative to an unexpected working directory.
- Solution:
- Verify Paths: Double-check the solution variable or the projects path defined in your YAML. Ensure it precisely points to your solution file (e.g., **/*.sln to find any solution file, or a specific path like MySolutionFolder/MySolution.sln).
- Inspect Working Directory: Add temporary diagnostic steps to your pipeline YAML like script: | echo “Current directory: $(pwd)” (for Linux/macOS) or script: | dir (for Windows) to print the agent’s current working directory. This helps confirm where your repository is cloned and how paths should be relative to it.
- Example: If your SeleniumTests.sln is nested inside a folder named src in your repository, your YAML might need to specify solution: ‘src/**/*.sln’ or adjust the projects path accordingly.
- Verify Paths: Double-check the solution variable or the projects path defined in your YAML. Ensure it precisely points to your solution file (e.g., **/*.sln to find any solution file, or a specific path like MySolutionFolder/MySolution.sln).
- Cause: The build or restore task in your YAML (e.g., dotnet build $(solution)) is unable to locate your .sln (solution) or .csproj (project) file within the agent’s workspace. This usually means the path specified in your YAML is incorrect or relative to an unexpected working directory.
- “NuGet package restore failed”:
- Cause: Your C# project depends on NuGet packages that the pipeline agent failed to download or resolve. This can stem from various reasons, including network issues, incorrect package sources, or authentication problems for private feeds.
- Solution:
- nuget.config Verification: If your project uses private NuGet feeds, ensure your nuget.config file is correctly placed in the repository’s root (or a well-known location) and that any required authentication tokens or service connections are properly configured in your Azure DevOps project.
- Network/Proxy: For self-hosted agents, check for any network connectivity issues or proxy server configurations that might be blocking access to nuget.org or your private feeds. Microsoft-hosted agents typically have robust connectivity.
- Package References: Confirm that all necessary NuGet packages (e.g., Selenium.WebDriver, NUnit.Framework, WebDriverManager) are correctly referenced in your .csproj files and that their versions are compatible.
- nuget.config Verification: If your project uses private NuGet feeds, ensure your nuget.config file is correctly placed in the repository’s root (or a well-known location) and that any required authentication tokens or service connections are properly configured in your Azure DevOps project.
- Cause: Your C# project depends on NuGet packages that the pipeline agent failed to download or resolve. This can stem from various reasons, including network issues, incorrect package sources, or authentication problems for private feeds.
- “Build failed with compilation errors” (e.g., syntax errors, missing references):
- Cause: Your C# code within the project (either application code or test code) contains actual compilation errors that prevent the solution from building successfully. These are the same types of errors you’d see in Visual Studio’s Error List.
- Solution:
- Review Build Logs: Meticulously examine the build logs in the pipeline output. Azure Pipelines will display the exact compilation errors with their respective CS codes and line numbers, just like your local IDE.
- Local Build Validation: Always ensure that your project builds successfully locally (by running dotnet build from your terminal or Build Solution in Visual Studio) before pushing changes to Azure Repos. This catches most compilation issues early.
- SDK Version Mismatch: Verify that the .NET SDK version specified in your pipeline’s UseDotNet@2 task (e.g., version: ‘6.0.x’) matches the version you are using locally and that your project targets. Inconsistencies can lead to build failures.
- Example: An error message like CS0103: The name ‘IWebDriver’ does not exist in the current context typically indicates that the Selenium.WebDriver NuGet package either wasn’t properly referenced in your project file or failed to restore during the NuGetCommand step.
- Review Build Logs: Meticulously examine the build logs in the pipeline output. Azure Pipelines will display the exact compilation errors with their respective CS codes and line numbers, just like your local IDE.
- Cause: Your C# code within the project (either application code or test code) contains actual compilation errors that prevent the solution from building successfully. These are the same types of errors you’d see in Visual Studio’s Error List.
Test Execution Errors
These errors occur when the application’s code successfully builds, but the dotnet test or VSTest step within your pipeline fails, indicating issues with your automated tests themselves.
- “No tests found to run”:
- Cause: The dotnet test or VSTest task could not locate any executable test assemblies or individual test methods within them. This means the test runner literally didn’t find anything to execute.
- Solution:
- Correct Test Assembly Path: Ensure the testAssemblyVer2 pattern in your VSTest@2 task (e.g., **\*test*.dll) or the projects argument in your DotNetCoreCLI@2 test task correctly points to the compiled .dll file of your Selenium test project (e.g., projects: ‘**/YourSeleniumTests.csproj’).
- Test Attributes: Verify that your test methods are correctly decorated with the appropriate test framework attributes (e.g., [Test] for NUnit, [Fact] for xUnit.net, [TestMethod] for MSTest) and that your test classes are public.
- Test Adapter Packages: Crucially, confirm that you have the correct test adapter NuGet package installed in your test project (e.g., NUnit3TestAdapter, Xunit.runner.visualstudio, MSTest.TestAdapter). Without these, the test runner cannot discover your tests.
- Cause: The dotnet test or VSTest task could not locate any executable test assemblies or individual test methods within them. This means the test runner literally didn’t find anything to execute.
- OpenQA.Selenium.WebDriverException: unknown error: Chrome failed to start: exited abnormally.:
- Cause: This is an extremely common error when ChromeDriver (or any other browser driver) fails to launch the Chrome browser on the build agent. This often indicates environmental issues on the agent, especially its lack of a graphical interface.
- Solution:
- Headless Configuration (Most Common Cause): The primary solution is to ensure you are running Chrome in headless mode on the agent. As detailed in Section 7, you must add options.AddArgument(“–headless”); to your ChromeOptions within your C# SetUp method.
- Driver & Browser Compatibility: Verify that the version of your ChromeDriver (Selenium.WebDriver.ChromeDriver NuGet package) is compatible with the version of Chrome installed on the Azure Pipeline agent. Microsoft-hosted agents have specific versions of browsers; ensure your driver matches.
- Agent Environment Dependencies: For self-hosted agents, confirm that all necessary operating system dependencies for running headless Chrome (e.g., libgconf-2-4 on Linux, specific display settings for Windows headless environments) are installed.
- Resource Issues: In rare cases, the agent might be running out of memory or CPU. Try adding additional headless arguments like –disable-gpu, –no-sandbox (for Linux/Docker), and –disable-dev-shm-usage to further optimize resource usage.
- Headless Configuration (Most Common Cause): The primary solution is to ensure you are running Chrome in headless mode on the agent. As detailed in Section 7, you must add options.AddArgument(“–headless”); to your ChromeOptions within your C# SetUp method.
- Cause: This is an extremely common error when ChromeDriver (or any other browser driver) fails to launch the Chrome browser on the build agent. This often indicates environmental issues on the agent, especially its lack of a graphical interface.
- OpenQA.Selenium.NoSuchElementException: No such element: …:
- Cause: Your Selenium test script attempted to find a specific web element (e.g., a button, a text field) using a locator (ID, XPath, CSS Selector), but that element was not present on the web page when the search was performed. This is often a timing issue or a locator problem.
- Solution:
- Implement Proper Selenium Waits: This is the most crucial solution. Web applications are dynamic; elements may not be immediately available when the page initially loads.
- Implicit Waits: Set an implicit wait globally for your driver
- (e.g., _driver.Manage().Timeouts().ImplicitWait = TimeSpan.FromSeconds(10);)
- This tells Selenium to poll the DOM for a certain period before throwing an exception.
- Explicit Waits: Use WebDriverWait for specific conditions, such as waiting for an element to be clickable, visible, or present
- (e.g., WebDriverWait wait = new WebDriverWait(driver, TimeSpan.FromSeconds(15)); wait.Until(ExpectedConditions.ElementIsVisible(By.Id(“username”)));).
- Validate Selectors: Carefully double-check your element locators (ID, Name, Class Name, XPath, CSS Selector). UI changes in the application can often lead to outdated locators. Use your browser’s developer tools to inspect the elements on the target page.
- Screenshots on Failure: Implement logic in your C# Selenium tests to automatically capture screenshots on failure and attach them to your test results in Azure Pipelines. This provides invaluable visual context, showing exactly what the browser saw at the moment the test failed, which is critical for debugging UI issues.
- Implement Proper Selenium Waits: This is the most crucial solution. Web applications are dynamic; elements may not be immediately available when the page initially loads.
- Cause: Your Selenium test script attempted to find a specific web element (e.g., a button, a text field) using a locator (ID, XPath, CSS Selector), but that element was not present on the web page when the search was performed. This is often a timing issue or a locator problem.
Pipeline Agent Gotchas
These issues are less about your code and more about the configuration or environment of the Azure Pipelines agent itself, especially if you are using self-hosted agents.
- Missing Software on Self-Hosted Agents:
- Cause: Your self-hosted agent doesn’t have required software (e.g., .NET SDK, Chrome browser, specific dependencies for Chrome headless) installed or configured in its PATH.
- Solution: Install all necessary software on your self-hosted agent. Ensure environment variables are correctly set. For Chrome, simply installing Chrome isn’t enough; you might need libgconf-2-4 for Linux or ensure display settings for Windows.
- Cause: Your self-hosted agent doesn’t have required software (e.g., .NET SDK, Chrome browser, specific dependencies for Chrome headless) installed or configured in its PATH.
- Resource Constraints (CPU/Memory):
- Cause: The build agent (especially shared or smaller ones) might run out of CPU or memory, causing tests to crash or hang.
- Solution:
- Use headless browsers.
- Optimize your tests (e.g., avoid unnecessary waits, release resources).
- Run tests in parallel across multiple agents or jobs (more resources needed).
- Consider using a more powerful agent (for self-hosted) or a larger VM size (for Azure DevOps agent pools).
- Cause: The build agent (especially shared or smaller ones) might run out of CPU or memory, causing tests to crash or hang.
- Timeouts:
- Cause: A build step or the entire job takes longer than the allowed timeout. This can happen if tests are very slow, or the agent gets stuck.
- Solution:
- Optimize test execution time (headless, parallel, efficient tests).
- Increase the timeout for the specific task or job in your YAML. (e.g., timeoutInMinutes: 60 for a job).
- Check logs for the last executed step to pinpoint where the hang occurred.
- Cause: A build step or the entire job takes longer than the allowed timeout. This can happen if tests are very slow, or the agent gets stuck.
- Flaky Tests:
- Cause: Tests that pass sometimes and fail other times without code changes, often due to timing issues, environment inconsistencies, or poor synchronization.
- Solution: This is a broad topic, but key approaches include:
- Robust Waits: Use explicit waits effectively to wait for elements to be clickable/visible.
- Retry Logic: Implement retry mechanisms for flaky tests within your test framework or pipeline.
- Environment Stability: Ensure your test environment is consistent and isolated.
- Review Test Logic: Re-evaluate and refactor flaky Selenium tests for race conditions or implicit dependencies.
- Cause: Tests that pass sometimes and fail other times without code changes, often due to timing issues, environment inconsistencies, or poor synchronization.
By systematically approaching these common issues with a combination of code-level fixes, pipeline configuration adjustments, and environment checks, you can ensure your Selenium tests run reliably and effectively within your sophisticated Azure Pipelines CI/CD setup.
Witness how our meticulous approach and cutting-edge solutions elevated quality and performance to new heights. Begin your journey into the world of software testing excellence. To know more refer to Tools & Technologies & QA Services.
If you would like to learn more about the awesome services we provide, be sure to reach out.
Happy Testing 🙂


