

Mobile performance testing is now essential to delivering high-quality mobile applications in a fast-paced digital environment. Users expect fast, streamlined, and responsive mobile experiences. Therefore, it is essential to ensure the app “performs” well across different devices, operating systems, and network conditions, which is the main focus of mobile performance testing. Mobile performance testing measures and improves a variety of performance aspects, including application load time, responsiveness, resource usage, and efficiency with power consumption and battery. Performance testing identifies performance bottlenecks early and provides a better user experience across all aspects of the test.
As mobile applications become more complicated and resource heavy with additional features, additional performance testing can assist developers and QA teams to ensure stability, speed, and reliability in the application for multiple scenarios in the real world. Keep in mind that the team will be overtly defensive in their efforts if they implement best practices and use some of the recommended performance testing tools. It is beneficial to identify potential issues or bottlenecks but, equally as important is the team’s ability to put into place further optimizations that will make the application perform better. In this blog, we will explore proven strategies, tools, and practices to help you implement effective mobile performance testing in your development lifecycle.
- Why Mobile Performance Testing Matters
- Common Performance Challenges in Mobile Apps
- Understanding Mobile Performance Metrics
- Types of Mobile Performance Testing
- Key Tools for Mobile Performance Testing
- Best Practices for Efficient Mobile Performance Testing
- Common Pitfalls to Avoid in Mobile Performance Testing
- Integrating Performance Testing into CI/CD
- Real-life example
- Conclusion
Why Mobile Performance Testing Matters
With the pace of change in the digital space today, people expect their apps to load quickly, response times to be fast, and they expect them to work! A delay of a few seconds is often enough to send users away from your app to the top competitor. There are millions upon millions of apps available and users can pick the first reply to their search request or they can even leave a review with less-than-stellar feedback on an app’s performance. Performance is no longer seen as a “nice to have” and is a critical success factor.
Mobile performance testing can confirm that your application can deliver a consistent and smooth experience for a person using it under a variety of different conditions (different devices, networks, and usage). It can help discover bottlenecks in time and speed of usage, and assure that resources are utilized effectively. And most importantly, with regard to performance, it assures that users will stick with the app because it is validating and performing well in the real world.
Any mobile product has the potential for poor performance, whether you are developing a productivity app, a children’s game, or an e-commerce platform. So you don’t want to have the negative attrition in terms of users, traffic, and revenue, and of course, your brand reputation, due to a poorly performing app. This is why performance testing must be a part of your development lifecycle, so that you can assure a high-quality mobile product.
Common Performance Challenges in Mobile Apps
Mobile app performance is influenced by countless factors, some of which the developer has no control over. Some of the common performance challenges are:
- Device Fragmentation: It is feasible to have thousands of devices that vary in CPU speed, memory, screen size, and operating systems. Having confidence that the mobile application will perform in the same way across these differences is a major hurdle.
- Network variability: Meanwhile, mobile users are switching from Wi-Fi to 4G, to 5G, or they are in poor connectivity situations (such as an elevator or a tunnel). As a result, the speed of the network and latency can greatly impact the performance of the app, and that is especially true for data-driven applications.
- Resource Constraints: Battery life, memory limitations and processing power, and the motor’s operating speed limit are all important aspects related to mobile devices. Applications that are poorly optimized and use too much CPU or battery time are usually deleted, solely on that basis.
- Operating System interrupts – background processes: Mobile OS may pause or kill apps or processes that are running in the background in order to save resources. Therefore, performance will impact apps that interact with other applications that are currently running in the background, as well as the other system processes.
- Animations and UI Rendering: A sluggish application can be shown by poor frame rate, poor transitions, or slow scrolling, which can quickly turn into a bad user experience. Performing some performance testing early in the process will help ensure that rendering and UI actions are smooth.
Recognizing these challenges early in the development cycle enables teams to create robust, user-friendly applications. The rest of this blog will explore how to tackle these issues effectively through best practices, tools, and testing strategies.
Understanding Mobile Performance Metrics
Performance testing begins with understanding what to measure. Mobile performance isn’t just about speed; it’s about user perception, system efficiency, and resource optimization. Let’s break down the key metrics you should monitor and why they matter with practical examples.
App Launch Time
- What it is:
App Launch Time measures how long it takes for the app to open and become interactive after the user taps the icon. - Why it matters:
First impressions are everything. A long launch time leads to user frustration and increased app abandonment rates. - Example:
Imagine a banking app that takes 5–7 seconds to launch, especially when a competitor opens in under 2 seconds. Users are more likely to switch to faster alternatives. A good target is to keep cold launch time under 2 seconds and hot launch time under 1 second. - How to measure:
Tools like Android Profiler, Xcode Instruments, or Firebase Performance Monitoring can help you track cold and warm launch times over time.
Resource Usage (CPU, Memory, Battery, Thermal)
- What it is:
This includes monitoring how much CPU your app consumes, how much memory (RAM) it uses, its impact on battery life, and if it causes the device to overheat. - Why it matters:
Apps that hog system resources lead to poor device performance, overheating, faster battery drain, and in some cases, OS-level throttling or app crashes. - Example:
A video streaming app that continues rendering and decoding video even when the user has paused playback may spike CPU usage, reducing battery life quickly. Over time, this could lead to negative reviews like “app drains battery fast.” - How to measure:
Use profiling tools like Android Studio Profiler, Xcode Instruments (Energy Log, Allocations), or third-party tools like Leaks Instrument to monitor real-time usage.
Network Usage and API Response Time
- What it is:
This refers to how much data your app consumes and how quickly it receives responses from APIs or external services. - Why it matters:
Slow or unoptimized network calls can lead to poor user experience, especially in regions with limited bandwidth. High data usage can also concern users with limited mobile data plans. - Example:
An e-commerce app that takes 4–5 seconds to load product images due to uncompressed files or large payloads can frustrate users. Optimizing image size and caching strategies can improve speed and reduce data usage. - How to measure:
Use tools like Charles Proxy, Wireshark, or Firebase Performance Monitoring to track API response times and payload sizes.
Frame Rendering & Scrolling Smoothness
- What it is:
This measures how smoothly the UI responds to user interactions, especially during animations or scrolling. It’s often evaluated in Frames Per Second (FPS) and jank rate. - Why it matters:
Laggy UI and janky scrolling break immersion and lead users to perceive the app as slow or buggy, even if the backend is responsive. - Example:
A social media app may freeze or stutter while scrolling through posts due to inefficient image loading or heavy background tasks on the main thread. Users expect 60 FPS for a fluid experience. - How to measure:
Use Android GPU Rendering Profile, Xcode’s Core Animation Instrument, or integration with Systrace to track rendering performance.
Types of Mobile Performance Testing
Mobile performance testing is not one-size-fits-all. Different scenarios call for different strategies to uncover bottlenecks and weaknesses. In this section, we’ll explore the five primary types of mobile performance testing, along with practical examples for each.
Load Testing
- What it is:
Load testing evaluates how the app behaves under expected user traffic or data load. The goal is to measure response times, resource usage, and stability when the system is under normal or peak operating conditions. - Example:
Let’s say you’re developing a food delivery app. You simulate 5,000 users browsing restaurants and placing orders at the same time, similar to peak dinner hours. Load testing helps ensure the backend, APIs, and database can handle this traffic smoothly. - Key Outcome:
You identify whether the app and infrastructure meet performance SLAs (Service Level Agreements) under normal and peak usage.
Stress Testing
- What it is:
Stress testing pushes the app beyond its capacity limits to observe how it behaves under extreme load. The goal is to find the breaking point and understand how the system recovers after failure. - Example:
Imagine your app handles 2,000 concurrent users under normal conditions. In stress testing, you might simulate 10,000 users hitting your login endpoint to see if the app crashes or throttles gracefully. - Key Outcome:
You discover how the app fails whether it degrades gracefully, freezes, or crashes and how it recovers after the stress ends.
Spike Testing
- What it is:
Spike testing checks how your app handles sudden surges in traffic, either a quick rise or drop in user activity. It’s a subtype of stress testing that evaluates responsiveness to abrupt traffic fluctuations. - Example:
Consider a ticket booking app for concerts. When sales open, traffic might spike from 500 to 15,000 users within a few seconds. Spike testing helps you prepare for such real-world rush scenarios. - Key Outcome:
You ensure your app can scale quickly and stabilize even when hit by an unexpected load surge.
Endurance (Soak) Testing
- What it is:
Endurance testing (also known as soak testing) evaluates the app’s long-term performance under a steady load. It helps identify memory leaks, CPU spikes, or database connection pool issues over time. - Example:
You simulate 1,000 users streaming music or watching videos on your app non-stop for 12 hours. If memory usage keeps increasing or the app becomes sluggish, it indicates a performance degradation over time. - Key Outcome:
You detect issues that don’t show up in short tests, like memory leaks or inefficient garbage collection.
Network Simulation Testing
- What it is:
This type of testing simulates varied network conditions such as 2G, 3G, 4G, 5G, or unstable Wi-Fi to test how your app performs in real-world connectivity scenarios. - Example:
You test your navigation app by simulating a slow 3G connection with 30% packet loss. You analyze whether the app still provides directions, updates maps, or handles offline gracefully. - Key Outcome:
You ensure a smooth user experience in regions with weak or fluctuating internet connectivity.
| Test Type | Purpose | Example Scenario | Goal |
|---|---|---|---|
| Load Testing | Test under expected traffic | 5,000 users ordering food | Stability under peak use |
| Stress Testing | Push beyond limits | 10,000 users logging in at once | Identify breaking points |
| Spike Testing | Sudden traffic bursts | Traffic surge when tickets go on sale | Elasticity and scaling |
| Endurance (Soak) | Long-term usage | 12 hours of streaming | Detect memory/resource leaks |
| Network Simulation | Unstable network conditions | Simulate 3G with 30% packet loss | Ensure offline/poor network UX |
Key Tools for Mobile Performance Testing
Choosing the necessary tools for performance testing of your mobile app will ensure that your app can be tested properly under various devices, networks, and workloads. Each tool operates under a specific category, from monitoring CPU usage to identifying API response time. These tools together are a performance profile of your application.
Let’s look at the main tools that can help you accelerate your mobile performance testing, plus concrete examples for each one.
Android Profiler / Xcode Instruments
- Purpose:
These are platform-native tools you can use to determine the CPU, memory, network, and energy usage for iOS and Android apps.- Android Profiler (Android Studio): provides visuals of app performance on physical devices and emulators.
- Xcode Instruments (iOS) also provides vital tools for identifying performance issues (e.g., Time Profiler, Allocations, Energy Log).
- Example:
You are trying to test a fitness tracking app and want to learn why it is draining the battery so quickly. Using Xcode’s Energy Log or the Battery tab in Android Profiler shows that background GPS updates and UI rendering tasks are always running, even when you have the screen off. - Best for:
These tools will provide good insight into diagnosing UI lags, memory leaks and battery-sucking background processes.
Firebase Performance Monitoring
- Purpose:
A real-time, cloud-based performance monitoring tool for Android and iOS apps, part of the Firebase suite by Google. - Features:
- Tracks app startup time, network latency, screen rendering speed, and custom traces.
- Monitors performance across devices, geographies, and OS versions.
- Example:
In an e-commerce app, you use Firebase Performance Monitoring to measure API latency. You discover that product listing APIs are slow only in certain regions due to CDN misconfiguration — something you’d miss in local testing. - Best for:
Live performance tracking post-deployment and identifying issues at scale.
Charles Proxy / Wireshark
- Purpose:
These tools capture and analyze network traffic. They help identify large payloads, inefficient API calls, and insecure data transfers.- Charles Proxy is more UI-friendly and great for mobile debugging.
- Wireshark is a powerful packet sniffer used for deep-dive network analysis.
- Example:
In a social networking app, Charles Proxy reveals that your app is fetching high-resolution profile pictures even on slow networks. By introducing adaptive image loading, you improve loading speed and reduce data usage. - Best for:
Inspecting API performance, data compression, security, and bandwidth consumption.
JMeter with Mobile Emulators
- Purpose:
Apache JMeter is a load testing tool that can simulate thousands of concurrent users and assess backend/API performance under stress. - Use with Emulators:
You can combine JMeter with mobile emulators or devices to mimic real app interactions and observe backend behavior under load. - Example:
For a food delivery app, you use JMeter to simulate 1,000 users placing orders within 5 minutes. Backend logs reveal delayed order processing and overloaded database writes, prompting you to optimize the API. - Best for:
Load testing and backend performance validation in mobile applications.
Best Practices for Efficient Mobile Performance Testing
Performance testing for mobile is not only about picking the right tools; it is also about developing the right design/testing habits in your development and testing ecosystem so that poor performance does not accidentally find its way to production. Some proactive best practices teams can adopt to ensure they deliver a high-quality app experience from day one are:
Let’s explore the performance test best practices and examples for each.
Start Early in the Development Cycle
- Why it matters:
Waiting until the end of development to start performance testing often leads to last-minute fixes or unresolvable issues. Instead, integrate performance checks early (Shift-Left Testing) to catch bottlenecks before they escalate. - Example:
In a fintech app, an API call for fetching user transactions is slow but isn’t noticed until the final build. Had the team tested earlier, they could have optimized the backend logic when it was easier and cheaper to fix. - Pro Tip:
Use lightweight profiling tools in your daily builds to track regressions continuously.
Test on Real Devices and Networks
- Why it matters:
Emulators and simulators are helpful in early development, but they don’t reflect real-world performance. Real devices vary in screen size, RAM, CPU, and network modules, which directly affect app behavior. - Example:
Your team tests an app on high-end devices only. Once released, users on low-end devices report lag and crashes due to memory constraints. Testing on a range of actual devices helps avoid this. - Pro Tip:
Maintain a test lab with low-end, mid-range, and flagship devices across Android and iOS.
Simulate Real-World Scenarios
- Why it matters:
Users don’t operate in controlled environments. They switch networks, multitask, receive calls, and use low battery modes. Simulating these conditions reveals how your app handles interruptions and constraints. - Example:
You simulate a 3G network with packet loss for a ride-sharing app. You find that map updates freeze intermittently, indicating a need for better offline handling or retry logic. - Pro Tip:
Use tools like Network Link Conditioner (iOS) or Android’s Network Profiler to replicate network variability.
Automate Performance Tests Where Possible
- Why it matters:
Manual performance testing is time-consuming and inconsistent. By automating performance test scripts, you can run tests frequently (e.g., in CI/CD pipelines) and catch regressions early. - Example:
In a news app, you automate a test to measure article load time after scrolling. Every time the app is built, the test checks for any slowdowns, ensuring new features don’t degrade speed. - Pro Tip:
Use tools like Appium with custom timers, or integrate performance thresholds into your test automation framework.
Monitor Resource Usage Continuously
- Why it matters:
CPU spikes, memory leaks, or battery drains often appear after prolonged use, not in short tests. Continuous monitoring helps catch these long-term issues. - Example:
In a music streaming app, you notice via Firebase Performance Monitoring that memory usage steadily increases over 2 hours of use. This indicates a memory leak that could crash the app in real scenarios. - Pro Tip:
Use tools like LeakCanary (Android) or Instruments (iOS) for memory leak detection, and monitor trends over time.
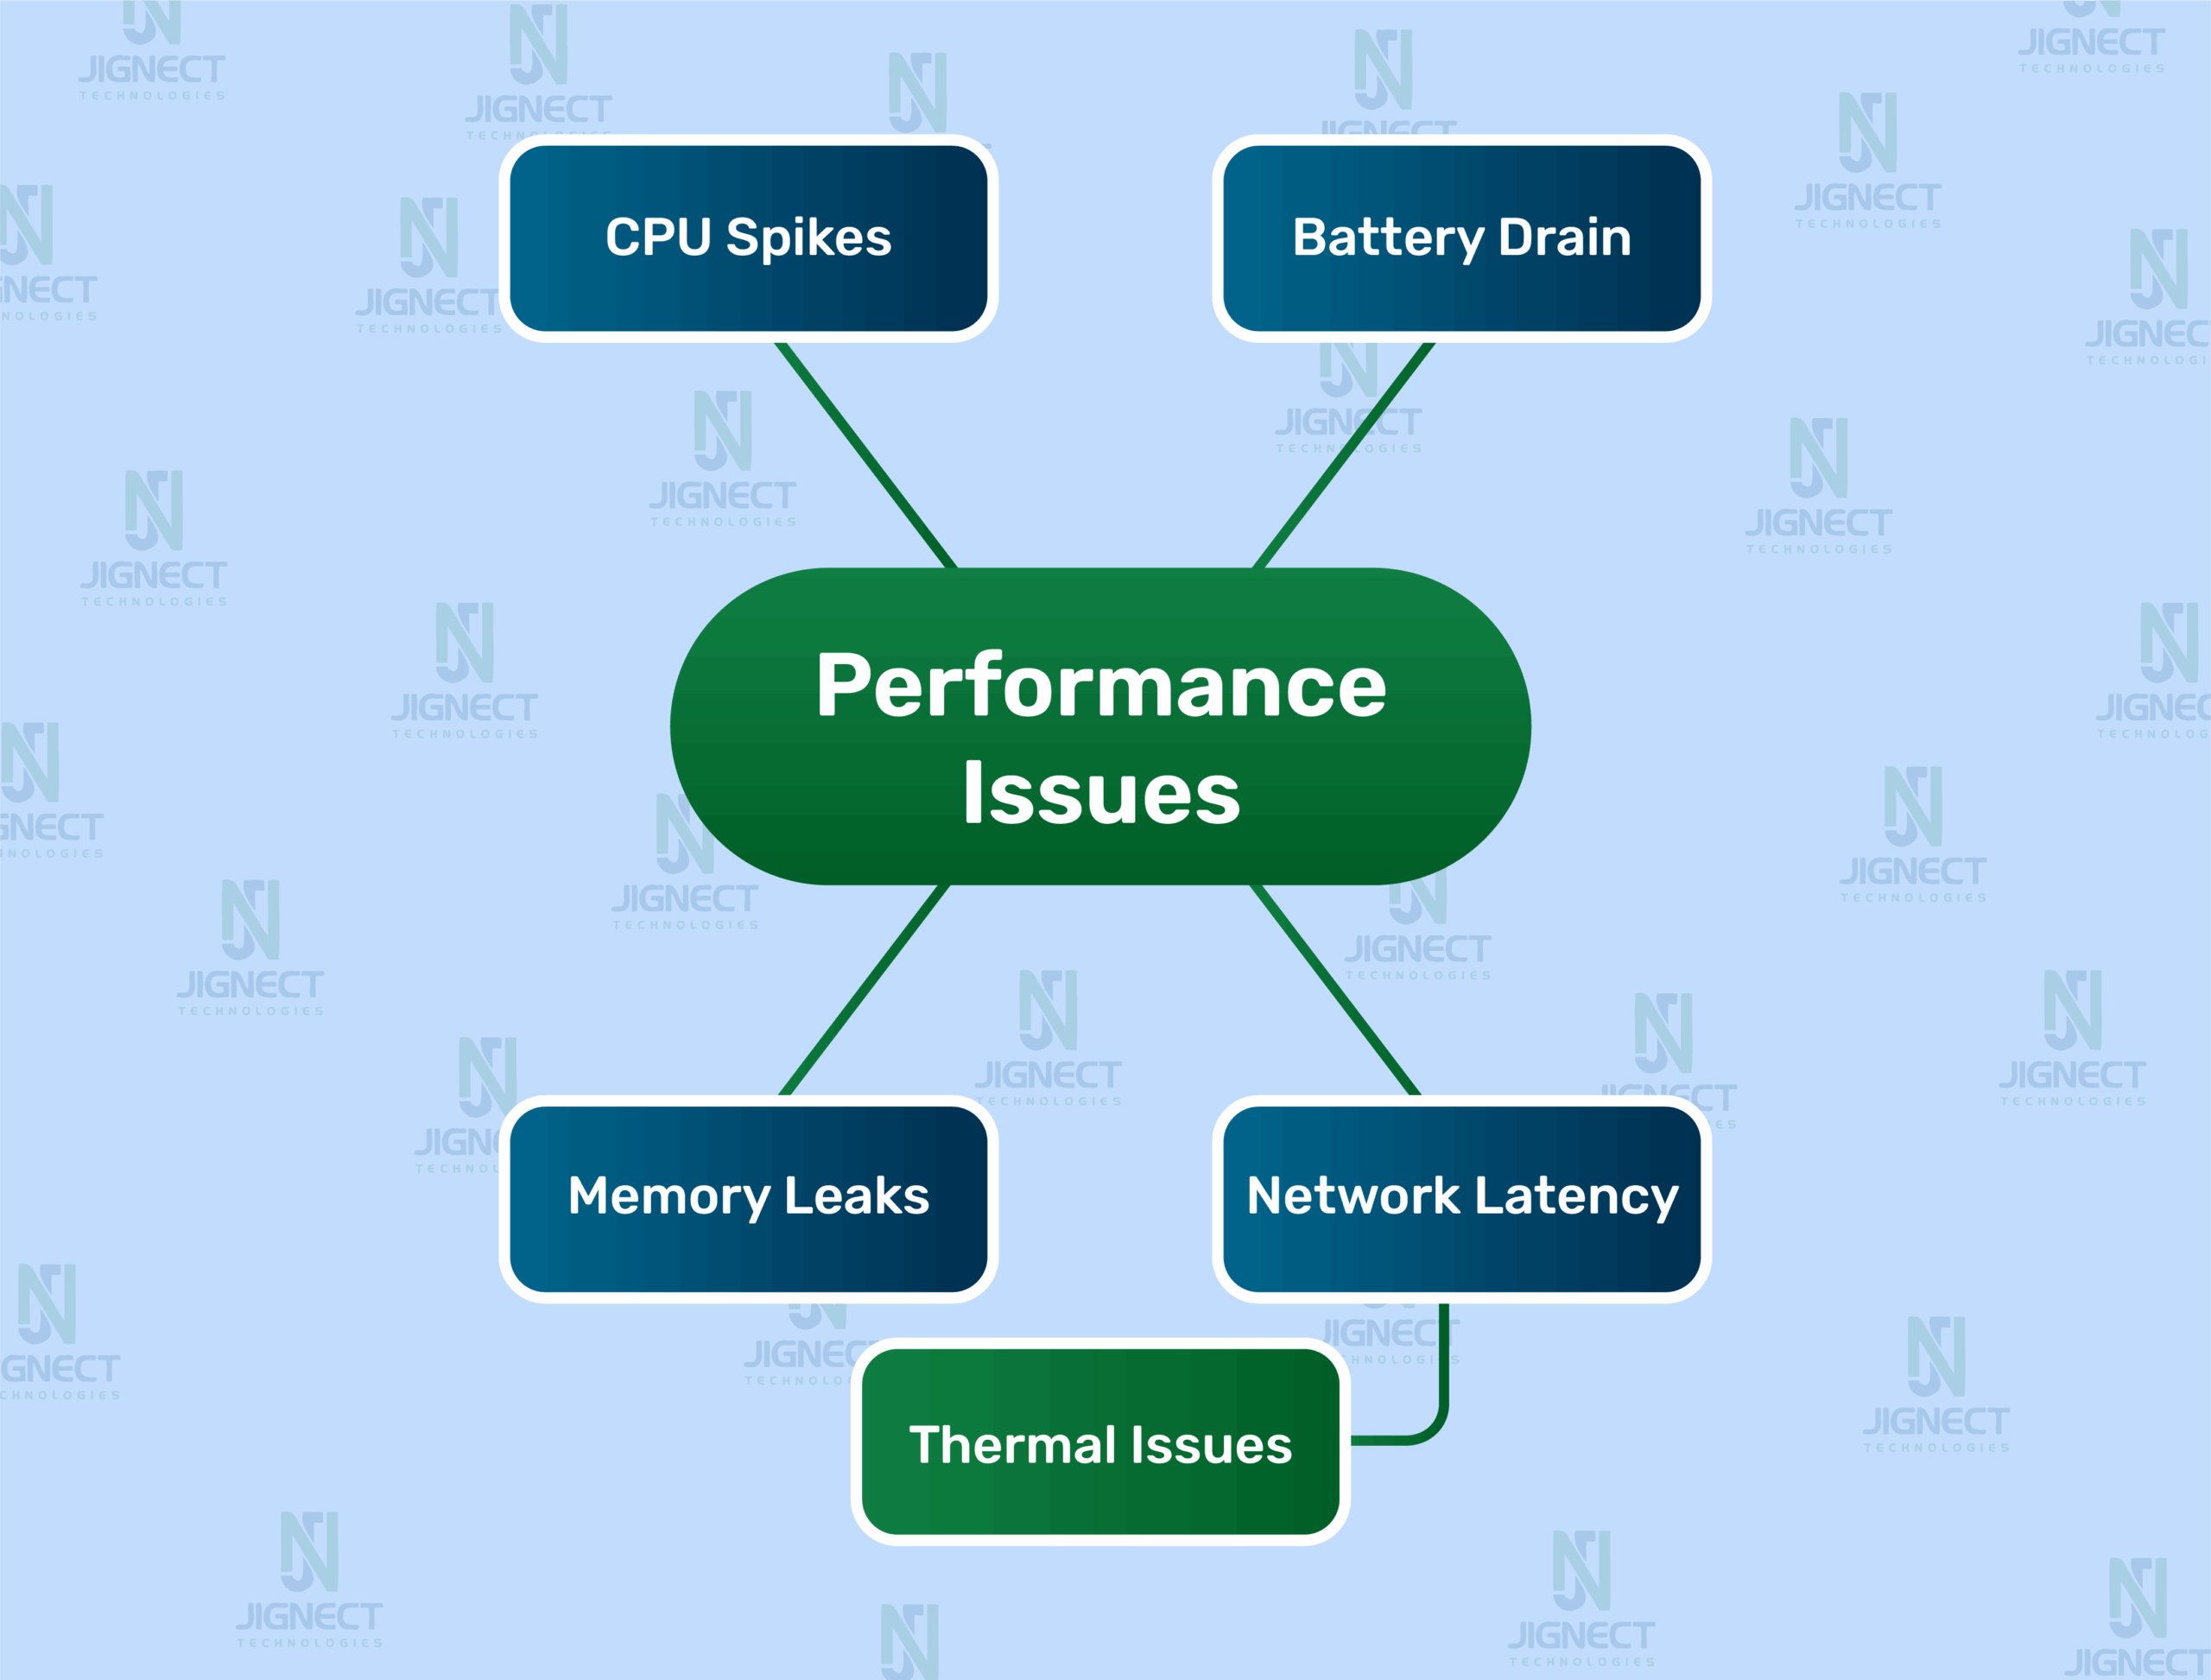
here the flow chart of Continuous monitoring helps identify memory leaks, CPU spikes, and battery drains
Set Performance Budgets and SLAs
- Why it matters:
Just like code quality standards, you need performance targets. Define measurable goals such as “Cold launch time \< 2 seconds” or “API response time \< 500ms.” - Example:
For an online shopping app, you define a budget of max 1.5s API latency for checkout. During performance regression testing, any result above this threshold blocks the release, ensuring consistency. - Pro Tip:
Make performance part of your Definition of Done (DoD) and track it in pull requests and CI builds.
Common Pitfalls to Avoid in Mobile Performance Testing
Even with the right tools and intentions, performance testing can fall short if certain critical mistakes are made. Many teams unknowingly limit the effectiveness of their tests by skipping real-world considerations. In this section, we’ll break down the most common pitfalls and how to avoid them.
Relying Solely on Emulators
- Why it’s a problem:
Emulators are great for quick tests and debugging, but they don’t simulate real hardware constraints like CPU throttling, memory limitations, battery consumption, or network variations. Relying only on them gives a false sense of app performance. Relying only on them gives a false sense of app performance. - Example:
A team tests an image-heavy social media app on emulators, where it runs smoothly. However, when users on older phones start using the app, they report crashes and slow loading. The emulator didn’t reflect the device’s actual limitations. - How to avoid it:
Always include real-device testing (low-end, mid-range, and flagship models) as part of your performance test plan.
Ignoring Background App Behavior
- Why it’s a problem:
Many apps behave differently when running in the background or after being resumed. Performance issues like memory leaks, battery drain, or data sync failures often surface in these states but are frequently missed. - Example:
A fitness app tracks user steps. When users minimize the app while walking, tracking pauses without notice. This wasn’t caught during testing because testers only used the app in foreground mode. - How to avoid it:
- Test how your app behaves when:
- Sent to background and resumed
- Used alongside other apps
- Subjected to system-level interruptions like calls or notifications
Skipping Testing on Older Devices or OS Versions
- Why it’s a problem:
Older devices and OS versions often have limited RAM, outdated processors, and different APIs. If you test only on the latest models, you risk alienating a large portion of your user base. - Example:
An education app runs flawlessly on Android 13 devices but crashes frequently on Android 8 due to a deprecated library call. Without backward compatibility testing, this issue went unnoticed until negative reviews surfaced. - How to avoid it:
- Maintain a test matrix that includes:
- Legacy OS versions (e.g., Android 8–9, iOS 12–13)
- Budget devices with low specs
- Global market–popular brands (e.g., Xiaomi, Samsung A-series)
Not Considering Different Network Conditions
- Why it’s a problem:
Assuming all users have fast, stable internet leads to serious performance blind spots. In reality, many users experience poor connectivity, high latency, or packet loss — especially in emerging markets or rural areas. - Example:
An online payment app works well on Wi-Fi but frequently fails transactions on 3G networks, leading to user frustration and financial loss. - How to avoid it:
- Use network simulation tools (e.g., Android Profiler, Charles Proxy, Network Link Conditioner) to test:
- Low bandwidth (2G/3G)
- Intermittent connections
- Offline scenarios
Integrating Performance Testing into CI/CD
Modern mobile apps require fast release cycles, and performance should not be compromised in the race to deploy. Integrating performance testing into your CI/CD pipeline helps detect issues before they hit production. This ensures each code change meets both functional and performance standards.
Let’s break it down into actionable strategies with examples.
Setting Up Automated Performance Gates
- What does it mean:
Just like unit or UI tests, you can add performance checks as gates in your CI pipeline. If an app build exceeds predefined thresholds (e.g., launch time, API latency), the build fails or is flagged preventing regressions from reaching users. - Example:
In a banking app, you define a gate that fails the build if login time > 3 seconds or CPU usage > 80% during load. Every commit triggers performance tests, and any violation blocks deployment to staging. - How to do it:
- Use tools like JMeter, Lighthouse CI, or custom Appium scripts with timers.
- Define performance budgets (e.g., max render time, acceptable frame drops).
- Include gates in Jenkins, GitHub Actions, GitLab CI, or CircleCI pipelines.
Performance Regression Monitoring
- What does it mean:
Even a small UI tweak or library upgrade can degrade performance. Monitoring for performance regressions ensures that changes don’t silently reduce app speed or responsiveness. - Example:
A food delivery app adds a new animation on the order confirmation screen. Post-deployment, screen rendering time jumps from 400ms to 1200ms. Because this wasn’t monitored, the issue wasn’t caught until user complaints. - How to do it:
- Store historical performance test results (e.g., in InfluxDB, Grafana).
- Run baseline comparisons against previous builds.
- Alert teams when key metrics (like launch time or frame rates) worsen by X%.
Reporting and Alerting with CI Tools
- What does it mean:
Automated test results are useless if they’re buried in logs. CI tools should generate clear, actionable reports and alert relevant teams when performance tests fail or metrics degrade. - Example:
Using GitHub Actions + Slack integration, your CI pipeline sends an alert to the #qa-alerts channel whenever API latency goes above 800ms in the latest build. The team is notified immediately and can take corrective action before merging the PR. - How to do it:
- Use plugins or scripts to generate HTML/JSON reports.
- Integrate with Slack, Teams, or email for instant alerts.
- Visualize trends in Dashboards (Grafana, Datadog, Firebase).
Real-life example
Performance Improvements After Best Practice Implementation
To truly understand the value of mobile performance testing, it helps to see how applying best practices makes a real-world difference. In this case study, we’ll walk through how a mobile team transformed a sluggish, crash-prone app into a smooth, responsive experience by simply integrating performance testing into their workflow.
Background
- App Type:
E-commerce Mobile App (Android + iOS) - Initial User Rating:
3.2 on Play Store - Common Complaints:
- Slow app launch
- Crashes on low-end phones
- The cart is taking too long to update
- Drains battery quickly during browsing
Step 1: Baseline Performance Testing
The QA team began by measuring key metrics using tools like Firebase Performance Monitoring and Android Profiler.
| Metric | Initial Reading |
|---|---|
| Cold Start Time | 6.1 seconds |
| API Response Time (Cart API) | 2.8 seconds |
| Memory Usage | 290 MB average |
| Crash Rate | 3.5% on Android 9 devices |
| Battery Consumption | 8% in the 10-minute session |
These values were clearly unacceptable, especially in competitive markets.
Step 2: Implementation of Best Practices
The team applied the following performance best practices:
- Added performance testing to CI/CD (Cold Start & Cart API latency monitored with each build)
- Tested on real devices across price segments (including Android Go phones)
- Simulated 3G/4G networks to understand load time under real conditions
- Refactored memory-heavy screens using flatlists & lazy loading
- Optimized backend APIs with gzip compression and caching
Step 3: Post-Implementation Results
After one month, here’s how the app’s performance improved:
| Metric | Before | After |
|---|---|---|
| Cold Start Time | 6.1s | 2.3s |
| Cart API Response | 2.8s | 750ms |
| Memory Usage | 290MB | 160MB |
| Crash Rate | 3.5% | 0.8% |
| Battery Usage | 8% / 10 min | 3% |
| Play Store Rating | 3.2 | 4.3 |
Want your app to run faster and smoother?
Our QA team can help find what’s slowing it down and fix it before your users notice.
Key Takeaways
- Real-device testing helped uncover hidden issues on low-end phones
- Performance budgets in CI/CD prevented regressions
- Simulating real-world conditions, like poor networks, revealed crucial bottlenecks
- Performance-focused refactoring significantly improved UX and app store ratings
Conclusion
Incorporating mobile performance testing best practices guarantees that mobile apps perform fast, reliably, and are built for real-world usage. Testing across devices, operating systems, and network conditions helps to identify additional hidden bottlenecks that may affect user experience. Integrating performance testing into CI/CD pipelines is a good way to check regressions as early as possible and maintain established quality with each release.
Using tools such as Firebase, Android Profiler, and Lighthouse to measure initial performance metrics such as launch time, memory footprint, battery drain, and network latency can show teams which key metrics are negatively impacting their applications’ performance. If teams can set performance budgets, measure, and have continuous measurement of those budgets, it offers better control over the application’s behavior as the app continues to evolve. Simulating a device with background activity, including a power of resources, and how device-specific behaviors impact performance can help demonstrate application stability across various scenarios.
Monitoring regressions while avoiding common mistakes, such as exclusively testing against emulators and sources of value at the limits with low-end devices while ignoring true network conditions are significant mistakes to avoid while trying to build a smooth and consistent user experience. Monitoring performance regression for production applications, along with time-sensitive and actionable reporting, and real-time alerts of potential threats to performance, gives teams better capacity to respond quickly in order to help stabilize their applications.
These best practices should contribute and lead to and improve high-performing mobile applications that help meet users’ expectations, decrease churn, and differentiate them from competitive app marketplaces. A focus on performance is more than just how quickly applications respond to user input – quality, consistency, responsiveness, and clear communication contribute to high performance.
Witness how our meticulous approach and cutting-edge solutions elevated quality and performance to new heights. Begin your journey into the world of software testing excellence. To know more refer to Tools & Technologies & QA Services.
If you would like to learn more about the awesome services we provide, be sure to reach out.
Happy Testing 🙂
")
