
Streamlining Enterprise Management: A Performance Testing Journey with Power BI Dashboards
Client Background and Project Goals
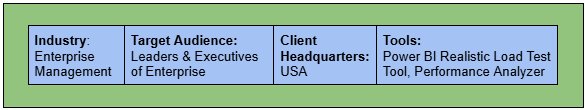
The client provides a platform that assists organizations in becoming more adaptable by offering insights into team performance, leadership, and the overall well-being of the organization. This platform enables companies to evaluate agility at various levels—teams, projects, and leadership—and delivers valuable feedback to enhance performance. The platform connects teams with goals, helping them work quickly and effectively, leading to better results and ongoing growth.
The goal of reaching out to Jignect is to check how well the Power BI dashboard works under different levels of user load while integrating with the application, ensuring it performs well and is reliable as Power BI dashboards are critical for business decision making.
Business Challenge
- Slow Dashboard Loading: Dashboards take too long to load due to complex queries, large datasets, or inefficient report design, leading to frustration and reduced productivity.
- Responsiveness Issues: High system memory (RAM) or CPU consumption during operation causes responsiveness problems and server Performance concerns when several users access dashboards.
- Time-Consuming Data Refresh: On-demand or scheduled data refreshes are excessively time-consuming, delaying updates with the most recent data and impacting analysis and decision-making.
- Slow or Failed Visual Rendering: Specific visuals (e.g., maps or charts with extensive data points and filters) load slowly or fail to render, reducing the dashboard’s reliability.
Solution Provided by Jignect
- Identify Bottlenecks: Use Performance Analyzer in Power BI to identify bottlenecks in queries, visuals, or data models.
- Streamline Visuals: Detect slow visuals using Performance Analyzer and optimize them by reducing data points or using more efficient visual types.
- Perform Load Testing: Conduct load testing with Power BI realistic load testing tools to evaluate resource impact under high traffic.
- Optimize Data Refresh: Analyze data refresh operations using Power BI tools to optimize query performance and data model structures.
Test Planning and Execution
- Tools Used:
- Power BI Realistic Load Test Tool: Simulated concurrent users and gathered performance data.
- Performance Analyzer: Captured detailed metrics for query execution and visual load times.
- Test Scope: Focused on critical dashboards with heavy data usage and complex calculations, emphasizing key user scenarios like data filtering, page loading, and slicer interaction. Expectation of concurrent users page refresh time is like below:
| No Of Concurrent Users | Expected Page Refresh Avg Time (In Seconds) |
| 1-3 | <3 |
| 3-10 | <5 |
| 10-20 | <8 |
- Scenarios Tested:
- Verify Power-BI dashboard load time for single user.
- Verify Power-BI dashboard load time for multiple user.
- Verify Power-BI dashboard load time for single and multiple users by page refresh.
- Verify Power-BI dashboard load time while filtering and slicing.
- Verify Power-BI dashboard single widgets refresh time with large dataset.
- Verify Power-BI dashboard all widgets refresh time with large dataset.
- Verify Power-BI dashboard for on-demand and scheduled data refresh.
- Verify Powe-BI dashboard for real-time updates from large datasets.
- Verify specific widgets load/query execution time using Performance Analyzer for different types of dataset.
- Verify widgets using Performance Analyzer for simple and complex queries.
- Testing Approach
- Baseline Testing:
- Measure dashboard and widget load times, responsiveness, and page refresh times with simple and complex queries using different dataset sizes to set performance benchmarks.
- Verify interaction latency and dataset refresh frequency (5-minute interval) under no load to establish baseline performance.
- Load Testing Setup:
- Configure 5 PCs, each supporting up to 4 users, based on maximum CPU core capacity recommended by the tool.
- Start load testing with 5 concurrent users and increase incrementally up to 20 users.
- Load Testing Execution:
- Simulate user interactions such as applying filters and slicers to mimic real-world usage.
- Measure average time to refresh the dashboard, query execution time, and latency for DAX calculations.
- Monitor the relationship between page refresh count, average refresh time, and the number of users to identify performance thresholds and bottlenecks.
- Baseline Testing:
Result and Benefits
- The report evaluates the load time Performance of the dashboard under varying user loads and during page refreshes.
- The impact of user load decreases as the number of page refreshes increases for all levels of user load.
- The average load time ranges between 7.3 seconds and 3.6 seconds for up to 5 concurrent users, from the 1st to the 20th dashboard refresh. However, with filters applied, the average load time during page refreshes remains between 10.7 seconds and 4 seconds.


Overall, the dashboard’s performance degrades under high user load, particularly during peak times. The following benefits are proposed to client:
- Enhance Performance: Improvement in performance of Power BI dashboard and integrated application dashboard.
- Enable Simultaneous Access: Allow multiple users to access the dashboard simultaneously without performance degradation.
- Improve Reliability: Ensure reliable data refresh for all widgets or individual components with the latest data.
- Support Decision-Making: Facilitate better decision-making processes to drive business profitability.
Conclusion:
The assessment with Jignect demonstrated the capability of the Power BI dashboard to handle varying levels of load effectively while seamlessly integrating with the application. The Performance testing ensured that the dashboard remained reliable, responsive, and capable of delivering critical insights for informed business decision-making, even under high-demand scenarios.
Witness how our meticulous approach and cutting-edge solutions elevated quality and performance to new heights. Begin your journey into the world of software testing excellence. To know more refer to Tools & Technologies & QA Services.
If you would like to learn more about the awesome services we provide, be sure to reach out.
Happy Testing 🙂


